BTC will fill CME GAP at around 77KWe're seeing some wild swings in Bitcoin's price, and I'm calling it: this isn't just the market doing its thing. I mean, where's all the BTC on exchanges? It's like there's none left, and the prices are shooting up to levels that Wall Street boys would think twice about jumping into.
This smells like big-time manipulation by the heavy hitters, like those hedge fund giants and the exchanges themselves. They've got the power to make the market dance, and with so little Bitcoin floating around, every move they make has an outsized impact. It's like they're playing with a loaded deck.
I'm not saying I've got the smoking gun, but the signs are there. When you see prices that don't match the supply, you gotta wonder, right? Are we just pawns in their game, or is there something else at play?
Let's keep our eyes peeled, because if this is manipulation, it's on a whole new level. What do you guys think? Am I onto something, or am I just seeing shadows?
Remember, this is speculative based on what we're observing in the market, and while manipulation is a concern, it's one among many factors influencing crypto prices.
Whats your thouhts?
BTCUSD01Q2025 trade ideas

BTC CME GAP
- A new gap was created this weekend on the CME.
- BTC's price is higher there, which is typical.
- A gap isn’t always filled; while many do eventually close as prices retrace, it’s never guaranteed.
- This isn’t a price analysis, but rather an alert to monitor the gap.
- I’ll add my previous gap analysis in the comments.
Happy Tr4Ding

Either this is dip or we are in bear marketCRYPTOCAP:BTC CME gap is nearly filled (ends at 77,930, bounced at 78,675). It also tested the 10-month MA (76K). Monthly RSI is at support, similar to August 2024, when price surged from 49K to 110K. There are several indicators tested such as distance to 50 day moving average as well as 200 day moving average current price. As long as it holds above 75-76K, the bull market remains intact.

BTC 160K in JulySimple fractal from last year summer doldrums on the the BTC chart.
Once we corrected to the 200 SMA (current spot) , a 2 month bottom consolidation followed and after 2 months, BTC reached all time high. That is my thesis going forward and it bodes well with the US new administration typical down turn within the first 100 days of taking office. Fed still tightening, rates still high, etc
Congruent also with a shift to an increase in global liquidity and lower rates incoming towards the summer, as the US economy is now showing obvious signs of weakness.
My 2 cents.

Btc cme gapBeen waiting for the Cme futures gap to be filled.For those who follow cme gaps know that they always get filled and price bounces from there. Also ma200 is below the gap which is a very good support and price should bounce from the ma200 lets see what happens 👀🚀

General Market Analysis - SMC Point of ViewIn this video I go through an analysis of DXY, EURUSD, USDCHF, OIL, and BTC. I also delve into why I think some short-term manipulation is happening and share my narrative.
I am not fond of giving a long description here when I give my analysis in the video, so please enjoy and share your thoughts.
- R2F Trading

Bitcon currently filling the CME futures gapWe knew it was likely this would happen at some point in the near future from when the gap was formed and it appears like now is the time. Price action needs to dip as low as $77,920to fill the gap entirely. History tells us the correction should be over with not long after the gap is filled. The only way this isn’t the case is if the top of the bull market was indeed already in, which is a very minute probability but not impossible. *not financial advice*

BITCOIN CME FORCASTIf CRYPTOCAP:BTC Dropped 🐻 Below $80k then Expect a good Bounce from $78k.
CRYPTOCAP:BTC Buy 🦖 Limit Orders
● $80500
● $78k

Will the bitcoin bloodbath send prices below its 200-day SMA?Currently lower for a sixth day, bitcoin futures have just tested the 200-day average for the first time this year. This clearly marks a pivotal moment for bulls and bears over the near term, but we also have to factor in the higher timeframes.
Matt Simpson, Market Analyst at City Index and Forex.com

Bitcoin Futures in Freefall !!Bitcoin Futures in Freefall: Navigating the Stormy Crypto Seas
As of February 27, 2025, Bitcoin futures have been experiencing significant volatility, reflecting the broader trends in the cryptocurrency market. The current price of Bitcoin futures on the CME (Chicago Mercantile Exchange) is approximately $84,945, which represents a notable decline from recent highs.
Market Overview
The cryptocurrency market has been under pressure due to a combination of factors, including regulatory uncertainties, macroeconomic conditions, and market sentiment. Bitcoin, being the flagship cryptocurrency, often sets the tone for the entire market. The recent drop in Bitcoin futures prices can be attributed to several key factors:
Regulatory Concerns: Governments and regulatory bodies worldwide have been tightening their stance on cryptocurrencies. This has led to increased scrutiny and potential regulatory actions, causing uncertainty among investors.
Macroeconomic Factors: The global economic environment, including inflation concerns and interest rate hikes, has impacted risk assets, including cryptocurrencies. Investors are becoming more cautious, leading to reduced demand for Bitcoin futures.
Market Sentiment: The overall sentiment in the cryptocurrency market has been bearish, with many investors adopting a risk-off approach. This has resulted in increased selling pressure and lower prices for Bitcoin futures.
Technical Analysis
From a technical perspective, Bitcoin futures have broken several key support levels, indicating a bearish trend. The price has entered a fair value gap (FVG) and is approaching an order block (OB), which could act as a support level. If the price finds support at the order block, there could be a potential reversal or consolidation before any further movement. However, if the price breaks below the order block, it could indicate further downside potential.
Future Outlook
The future outlook for Bitcoin futures remains uncertain, with several potential scenarios:
Regulatory Clarity: If regulatory bodies provide clear guidelines and frameworks for cryptocurrencies, it could boost investor confidence and lead to a recovery in Bitcoin futures prices.
Macroeconomic Stability: Improvements in the global economic environment, such as controlled inflation and stable interest rates, could positively impact risk assets, including Bitcoin futures.
Market Sentiment Shift: A shift in market sentiment towards a more bullish outlook could lead to increased demand for Bitcoin futures and higher prices.
Conclusion
In conclusion, the current situation with Bitcoin futures is characterized by significant volatility and uncertainty. Investors should closely monitor regulatory developments, macroeconomic conditions, and market sentiment to make informed decisions. While the short-term outlook may be bearish, there are potential catalysts that could lead to a recovery in the future.

Bitcoin Update: Critical Support & Elliott Wave Levels To WatchBitcoin here is the thing...
1. For now drop is not impulsive, so can be correction
2. 4th wave pullbacks will ideally stabilize near 50/38.2%. Just testing the important zone 77k-85k
3. Old high and unfilled gap are crucial to cause a bounce, otherwise the major high is in
4. You don't want to see this fourth wave breaking the lowest base channel line, otherwise top is in.
5. Bullish resumption for wave 5 when/if 93700 overlaps
6. This market wont go up unless risk-on is back
GH

BTCUSDT Futures Pick your poison! So long as 84.5k holds I believe we back test the upper CME gap at 93.6k to reject and fill the lower gap. With that being said I believe we head lowerhave short TP's set at 72, 68 and 62k. This matches my usdt.d analysis over the past few weeks since 107k

Bitcoin Is About To Turn Bullish (10X Alert!)It's been 1.5 months since the last low, which happened on the 10th of January. We are potentially looking at a higher low now and the start of a new bullish wave. This is a major development.
There isn't much to go by from the chart, only the fact that trading volume has been higher in previous drops. The total amount of long positions liquidated can also be considered; the market cycle; the fact that the year is 2025 and we are about to enter March.
The Cryptocurrency market will be 100% bullish in March.
Bitcoin will be bullish in March, so it is a possible that we are looking at a higher low on the 2D candle and this candle closes tomorrow.
I am doing, for my people, 10X on this chart setup.
10X is about the limit for our leveraged trades.
I only go to the upper range of the limit when we are really close to the next major market move. We know the next move is bullish and we know we are very close, for this reason we are ready to 'step in the gas', we are ready to go in with full force because Bitcoin (the Cryptocurrency market) is about to embark on a phase of long-term growth.
Now. All growth will not happen in a single week or a single day. This is a long-term process but bottom prices tend to be available only for a matter of days.
Is this really it?
When trading, specially with leverage, there is always high risk.
I can't say for sure if this is it, all we can do is take action, decide what we want to do next. Based on the chart, intuition and experience, we are ready for a new entry, the market will let us know if the timing was right. The market will reward us if timing was right, it will punish us if the timing was wrong.
If we get it right, that's great; enjoy the profits and move on.
If we get it wrong, no need to cry, no need to fight, the market goes down and goes up. We know how much risk we are taking based on the size of the position that we take. If a chart setup breaks down, there is one choice left and one only, try again. We never give up. Success is based on learning from past failures and mistakes. The more often we get it wrong, the more data we have to learn and grow.
The timing is right.
Thanks a lot for your continued support.
Namaste.

BTC1!/MBT1! Day Trade Plan for 02/26/25BTC1!/MBT1! Day Trade Plan for 02/26/25
📈 90155, 91590
📉 87280, 85850
Like and share for more daily ES/NQ levels 🤓📈📉🎯💰


Bitcoin 69K is inevitable!BTC 2 Week chart.
Simple yet convincing with only 3 reliable indicators.
69K is inevitable.
Also filling our remaining CME gap along the way!
Bottom of channel also possible if we get a Black Swan event again.

Confluence of fibs at 78k - 80k, trendline support and CME gapConfluence of fibs at 78k - 80k, trendline support and CME gap

BTS Heading to 74K or Is It Just a Shakeout?Not a pretty picture, is it? I hope it's just a shakeout of weak hands and not truly a breakdown.
The price has clearly closed below significant lows. Only saving grace is that the yesterday low is around 38.2% retracement of the rise from lows of August 2024 (sub 50K level).
Let's hope it reverses for good from here. If not, it's not just #BTC that will fall but majority of cryptos with it.

BTC update#BTC has 2 gaps in CME chart so these 2 should be filled i think that there is 2 scenarios once is rising to catch the small gap and then go down and the other one is go down to catch the big one and then rise to catch the other one !
any way we have to think for bearish in long term and in both scenarios the price will fall under 80K

BTC Mid-Term OutlookBitcoin is struggling to find bullish confluence, and we’re not seeing strong buy pressure at current levels. The nearest significant order blocks are much lower, around $69K, which could act as a magnet if sellers take control.
Adding to the uncertainty, potential tariffs from Trump could shake up the broader market, impacting risk assets like BTC in the short term. Without a strong push from bulls soon, the market will drift lower before any meaningful reversal.

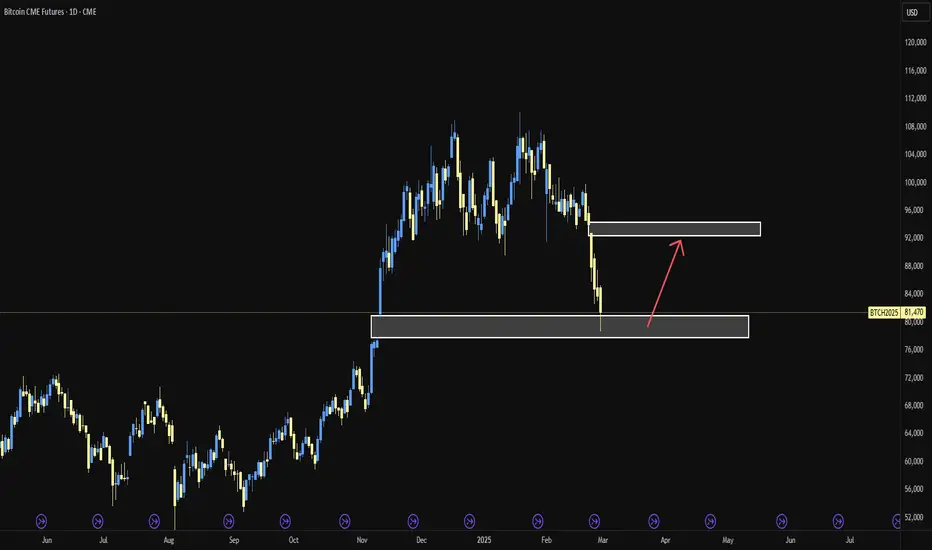
BTC start buying in the green zone been waiting Start Buying when price isn the green zone simple plan

BTC CME MMBM is over If we use data like Market Maker for the purchase, then perhaps we have completed it, now MMSM has worked
We see that December was aсamulation, January - manipulation and February - distribution with the completion and withdrawal of monthly liquidity for January, now we are in the zone of immediate inefficiency, 82-88k + emptiness at 77-80k
I will consider NWOG for 23 feb as resistance and a search for a short entry if the price goes there due to weekly inefficiency
