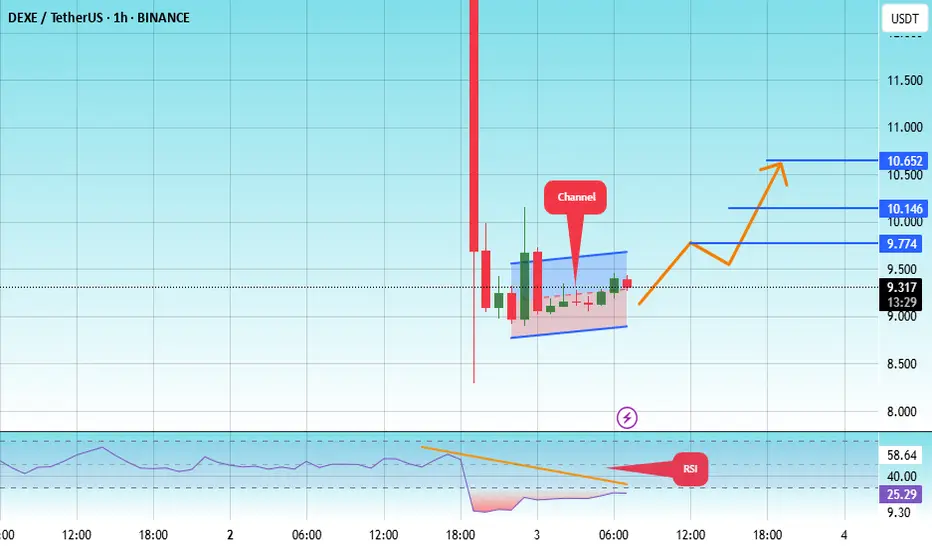
#DEXE/USDT#DEXE
The price is moving within a channel on the 1-hour frame, adhering well to it, and is heading for a strong breakout and retest.
We have a bounce from the lower boundary of the channel, this support at 8.93.
We have a downtrend on the RSI indicator that is about to be broken and retested, whi
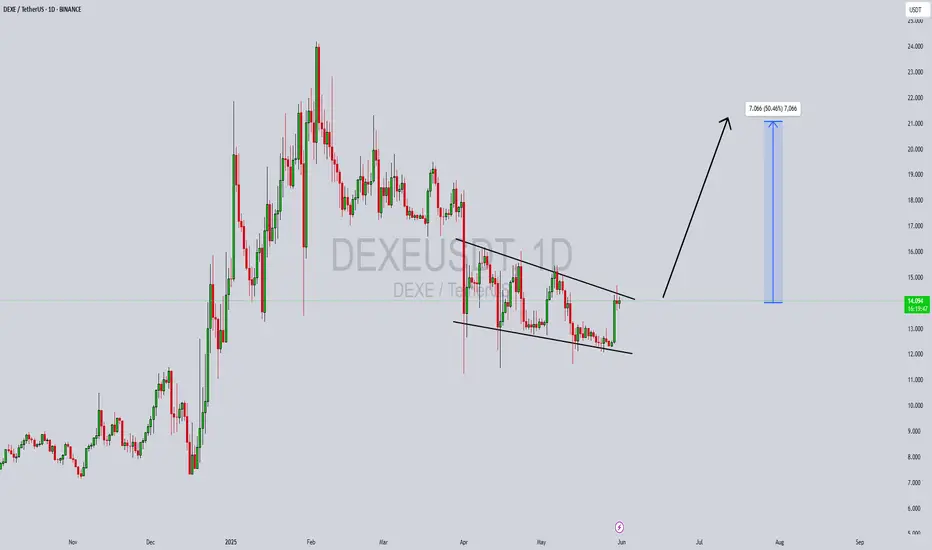
DEXE/USDT: FALLING WEDGE BREAKOUT!!DEXE Breakout Alert – 80% Move Loading?
Hey Traders! If you're into high-conviction plays and real alpha — hit that like and tap Follow for trade setups that actually deliver.
DEXE has broken out of a falling wedge pattern on the daily timeframe and has successfully retested the breakout level. Th


DEXEUSDT UPDATE
Pattern: Falling Wedge Breakout
Current Price: \$14.08
Target Price: \$17.53
Target % Gain: 25.65%
Technical Analysis: DEXE has broken out of a falling wedge pattern on the 12H chart, supported by strong bullish candles and a clear breakout above resistance. Price is consolidating above the bre

DEXEUSDT Forming a Bullish Wave DEXEUSDT is currently forming a bullish wave pattern, which indicates a strong continuation trend following a previous impulsive move. This technical formation, characterized by a series of higher highs and higher lows, reflects growing investor confidence and buying momentum. With good volume suppo
DEXE Update!You might not want to miss out on DEXE! 🚀
On the daily timeframe, DEXE has respected its support trendline and is currently in a rebound phase. The 100 EMA remains a key challenge, and historically, whenever DEXE has broken above it, the price has made massive moves.
With the support trendline hol

DEXE ANALYSIS📊 #DEXE Analysis
✅There is a formation of Descending triangle pattern on daily chart 🧐
Pattern signals potential bullish movement incoming after a breakout.
👀Current Price: $14.68
🚀 Target Price: $18.50
⚡️What to do ?
👀Keep an eye on #DEXE price action and volume. We can trade according to

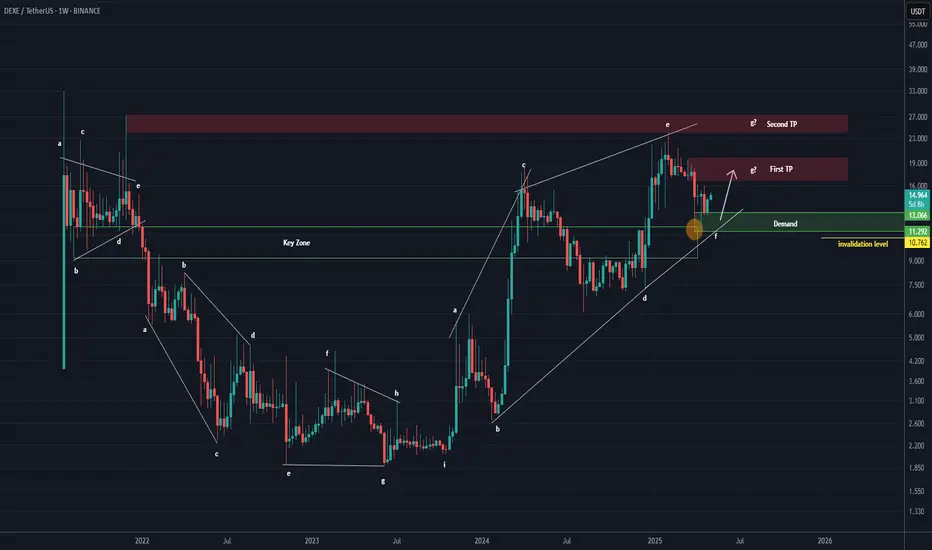
DEXE Analysis (1W)It appears to be in a bullish diametric pattern, and we are likely approaching the end of wave F.
If the price returns to the green zone, we will be looking for buy/long positions there.
We’ve marked two main targets on the chart, which represent the potential objectives for wave G.
A weekly cand
DEXEUSDT UPDATE
Pattern: Bullish Pennant Pattern
Current Price: $14.835
Target Price: $26.61
Target % Gain: 80.18%
Technical Analysis: DEXE has broken out of a descending triangle pattern on the 1D chart. The breakout is supported by a strong bullish candle and sustained price action above the trendline resist

DEXEUSDT 1D Analysis DEXE ~ 1D Analysis
#DEXE Buy gradually after successfully breaking through this resistance line with a short-term target of at least 10%+.

See all ideas
Summarizing what the indicators are suggesting.
Oscillators
Neutral
SellBuy
Strong sellStrong buy
Strong sellSellNeutralBuyStrong buy
Oscillators
Neutral
SellBuy
Strong sellStrong buy
Strong sellSellNeutralBuyStrong buy
Summary
Neutral
SellBuy
Strong sellStrong buy
Strong sellSellNeutralBuyStrong buy
Summary
Neutral
SellBuy
Strong sellStrong buy
Strong sellSellNeutralBuyStrong buy
Summary
Neutral
SellBuy
Strong sellStrong buy
Strong sellSellNeutralBuyStrong buy
Moving Averages
Neutral
SellBuy
Strong sellStrong buy
Strong sellSellNeutralBuyStrong buy
Moving Averages
Neutral
SellBuy
Strong sellStrong buy
Strong sellSellNeutralBuyStrong buy
Displays a symbol's price movements over previous years to identify recurring trends.
Curated watchlists where DEXEUSDT.P is featured.

Asset Management: Get your assets in gear
15 No. of Symbols
See all sparks