#DEXE/USDT#DEXE
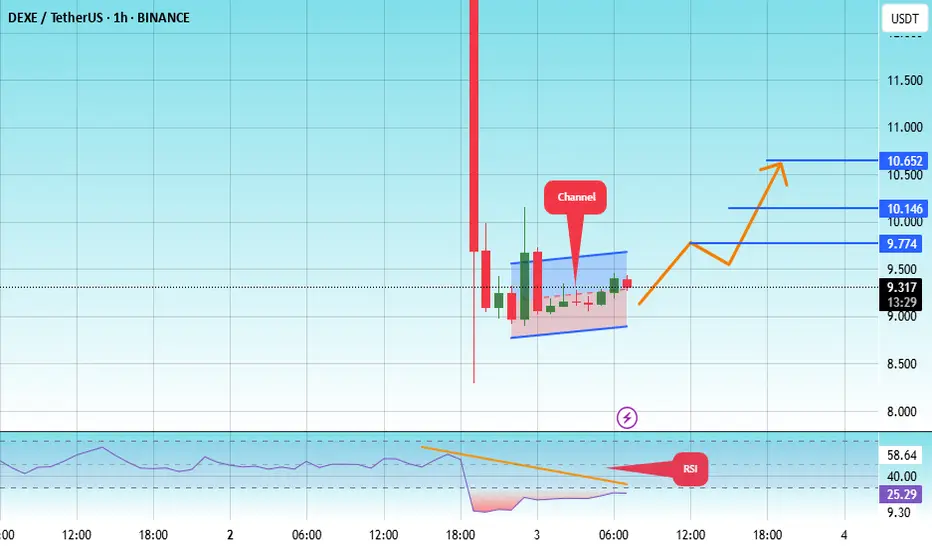
The price is moving within a channel on the 1-hour frame, adhering well to it, and is heading for a strong breakout and retest.
We have a bounce from the lower boundary of the channel, this support at 8.93.
We have a downtrend on the RSI indicator that is about to be broken and retested, which supports the upward trend.
We have a trend of consolidation above the 100 moving average.
Entry price: 9.30
First target: 9.60
Second target: 10.14
Third target: 10.65
DEXEUSDT trade ideas

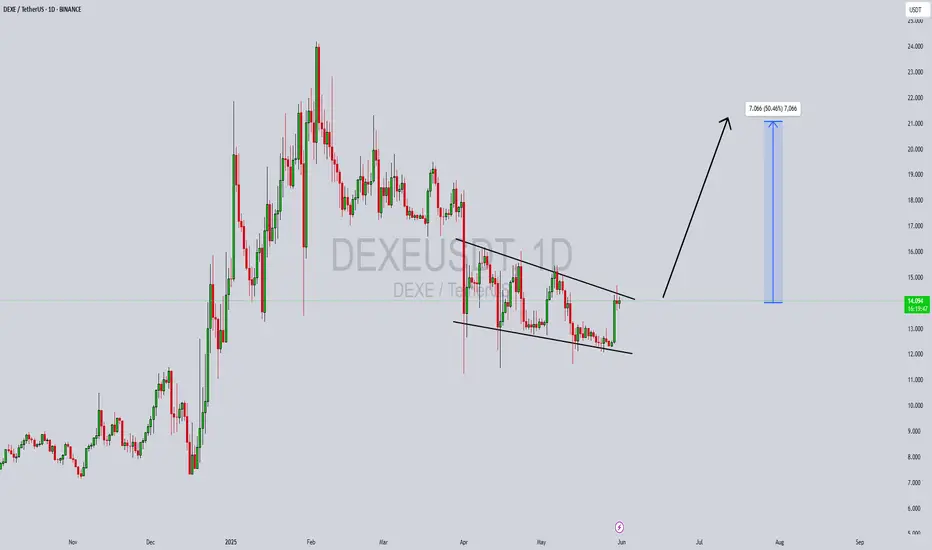
DEXE/USDT: FALLING WEDGE BREAKOUT!!DEXE Breakout Alert – 80% Move Loading?
Hey Traders! If you're into high-conviction plays and real alpha — hit that like and tap Follow for trade setups that actually deliver.
DEXE has broken out of a falling wedge pattern on the daily timeframe and has successfully retested the breakout level. The structure looks strong, and momentum is starting to build.
Entry Zone: $13.4 – $14.4
Targets: $16.1 / $18.2 / $21.2 / $24.4
Stop-loss: $12.60
Leverage: Use low leverage (Max 5x)
This could be the beginning of a powerful upward move.
Keep this setup on your radar and manage risk accordingly.
Let me know your thoughts or if you're riding this one too.

DEXEUSDT UPDATE
Pattern: Falling Wedge Breakout
Current Price: \$14.08
Target Price: \$17.53
Target % Gain: 25.65%
Technical Analysis: DEXE has broken out of a falling wedge pattern on the 12H chart, supported by strong bullish candles and a clear breakout above resistance. Price is consolidating above the breakout zone.
Time Frame: 12H
Risk Management Tip: Always use proper risk management.

DEXEUSDT Forming a Bullish Wave DEXEUSDT is currently forming a bullish wave pattern, which indicates a strong continuation trend following a previous impulsive move. This technical formation, characterized by a series of higher highs and higher lows, reflects growing investor confidence and buying momentum. With good volume supporting the price structure, the likelihood of a breakout continuation is high, targeting an expected gain of 40% to 50% in the medium term.
DeXe (DEXE) has been gaining traction within the decentralized finance (DeFi) sector. As a governance and staking token for the DeXe network, it offers a unique proposition in decentralized asset and portfolio management. This aligns with the growing demand for transparency and user empowerment in financial decision-making, which enhances its fundamental appeal. The recent bullish wave setup complements this strong narrative, making DEXEUSDT a compelling asset on both technical and fundamental fronts.
From a chartist’s perspective, confirmation of this pattern with a breakout above recent swing highs could attract both momentum and position traders. Supporting indicators such as RSI trending upward and MACD crossover point to increasing bullish strength. The combination of technical alignment and rising on-chain activity for DEXE fuels a high-probability trade setup for bullish continuation.
In conclusion, DEXEUSDT is on the radar of many smart money traders looking to ride the next impulsive leg. If this bullish wave completes as anticipated, we could see significant upside in the coming weeks, especially as DeFi regains momentum across the crypto space.
✅ Show your support by hitting the like button and
✅ Leaving a comment below! (What is You opinion about this Coin)
Your feedback and engagement keep me inspired to share more insightful market analysis with you!
DEXE Update!You might not want to miss out on DEXE! 🚀
On the daily timeframe, DEXE has respected its support trendline and is currently in a rebound phase. The 100 EMA remains a key challenge, and historically, whenever DEXE has broken above it, the price has made massive moves.
With the support trendline holding strong, there’s a solid probability for DEXE to begin a bullish rally. 📈
You can wait for a breakout confirmation to enter this trade, or hold a small position and DCA.
🔹 Strategy:
~ Entry: $12.50 to $14.50
~ Trade Type: Spot or 3x leverage
~ Holding Period: Q3 (July–September 2025)
~ Invalidation: Breakdown and close below the support trendline
📝 Note: Always do your own analysis before investing.

DEXE ANALYSIS📊 #DEXE Analysis
✅There is a formation of Descending triangle pattern on daily chart 🧐
Pattern signals potential bullish movement incoming after a breakout.
👀Current Price: $14.68
🚀 Target Price: $18.50
⚡️What to do ?
👀Keep an eye on #DEXE price action and volume. We can trade according to the chart and make some profits⚡️⚡️
#DEXE #Cryptocurrency #TechnicalAnalysis #DYOR

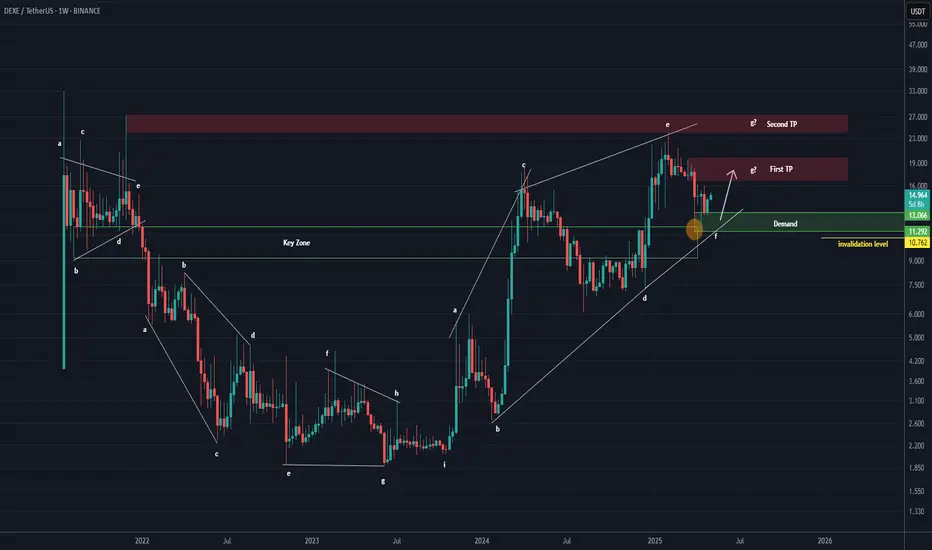
DEXE Analysis (1W)It appears to be in a bullish diametric pattern, and we are likely approaching the end of wave F.
If the price returns to the green zone, we will be looking for buy/long positions there.
We’ve marked two main targets on the chart, which represent the potential objectives for wave G.
A weekly candle closing below the invalidation level will invalidate this view.
For risk management, please don't forget stop loss and capital management
When we reach the first target, save some profit and then change the stop to entry
Comment if you have any questions
Thank You
DEXEUSDT UPDATE
Pattern: Bullish Pennant Pattern
Current Price: $14.835
Target Price: $26.61
Target % Gain: 80.18%
Technical Analysis: DEXE has broken out of a descending triangle pattern on the 1D chart. The breakout is supported by a strong bullish candle and sustained price action above the trendline resistance, indicating momentum toward the target.
Time Frame: 1D
Risk Management Tip: Always use proper risk management.

DEXEUSDT 1D Analysis DEXE ~ 1D Analysis
#DEXE Buy gradually after successfully breaking through this resistance line with a short-term target of at least 10%+.

DexeDexe usdt Daily analysis
Risk rewards ratio >5 👈👌
Time frame daily
First target =16$
2th target = 19.5 $
Stop is very tight. Below of support line.
If price break the support line and my stop , I don't lose because it's very tight. On the other hand, if price reach to my target , I get good benefit

Rebound PlayThe irregular volume on this is unsustainable for this asset as well and its likely to rebound rapidly with at least a 25% upside.
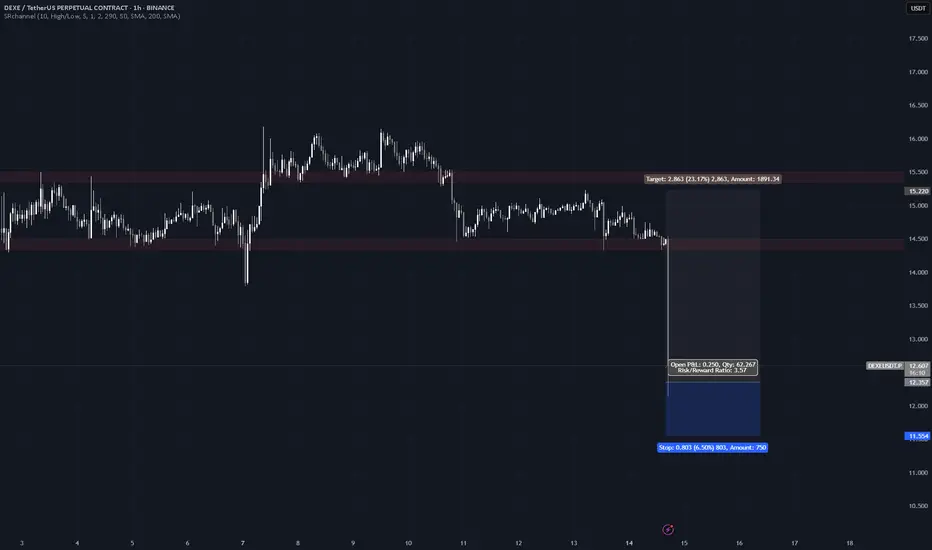
DEXEUSDT.P | Strong Bottom Formation: Is $17 Really the Target?Today's analysis is for #DEXEUSDT.P, friends! 🔍📊 We're seeing another solid bottom formation here. The minimum target is around $15.40 🎯.
To be honest, I’ve been waiting for the $16.5–$17 range for a while, and with this move, it might get there quickly 🚀.
Why? Because sellers above have already been cleared out, and I don’t expect heavy resistance until around $16.4 ⚔️.
Also, the funding fee looks quite attractive 💰 — so if you're into swing trades, holding the position while keeping an eye on funding might be a smart move 🧠.
But for scalpers or those who prefer lower risk, $15.40 is a solid short-term target 🟢.
Wishing you a day full of green candles! 💚📈
Manage your risk, stay in the game! 🎯🔥
#AlyAnaliz #TradeSmart #CryptoVision #DEXEUSDT #Binanciega

#DEXEUSDT - Will the Delayed Correlation Work Again? Hey friends, 🌟
I’ve been battling an illness lately, so I haven’t been able to share many analyses—sorry about that! 😷 But I’m back today with a fresh new analysis.
Today's focus: #DEXEUSDT 🔍📊 Stay tuned for the details!
#DEXEUSDT | A Unique Correlation Unveiled! 🔍📊
Looking at the #DEXEUSDT chart, it may seem a bit complex at first. However, I’ve discovered a delayed correlation with another coin—#BROCCOLIF3BUSDT. 🍀📈 These two coins exhibit a positive correlation, but #DEXEUSDT follows BROCCOLI with a delay. This means #DEXEUSDT tends to mirror BROCCOLI's movements after some time.
This correlation helps us see the bigger picture more clearly. The sharp downward movement in the past (highlighted in the left red box on the chart) represents a Supply-Demand zone, meaning the price is likely to retest this area before making a decision. For #DEXEUSDT, this critical level is around $18.
🔹 Primary Target: $18
🔹 TP1: $16.555
🔹 TP2: $16.800 - $17
Additionally, we’re observing a bullish flag formation. 🚩 The potential breakout level currently stands at $15.40, though this may shift over time. A confirmed breakout and retest would make a long position a safer bet.
Let’s see how this multi-layered analysis unfolds! 🚀
Stay green & trade smart! 💰🌱
Manage your risk, stay in the game! 🎯🔥
#AlyAnaliz #TradeSmart #CryptoVision #DEXEUSDT #Binanciega

LONG Position DEXE/USDT#Singal
DEXE/USDT
🟢 LONG Position
🎲 Entry1 @ 14.048
🎲 Entry2 @ 13.920
🎲 Entry3 @ 13.769
✅ Target1@ 14.393
✅ Target2 @ 14.838
✅ Target3 @ 15.407
✅ Target4 @ 16.471
✅ Target5 @ 18.188
❌ Stop Loss @ 12.514
Leverage: 5X_15X
Margin: 10% of Wallet Balance
⚠️"Take Care of Risk Management for Your Account"

DEXE/USDT Analysis. Market Maker LiquidationNews emerged that market maker Wintermute has started selling off tokens including ACT, TST, DF, DEXE, KAVA, HIPPO, LUMIA, BANANAS31, and QUICK. Many of these assets have dropped by 20-50%. Let's analyze one of them.
From the cluster chart, we identified a buyer absorbing the market aggression of sellers. If the price returns to the $13-$12 zone , we will monitor the reaction and enter a long position if confirmation appears.
This trade is suitable for intraday traders and scalpers, as it carries increased risk

DEXEUSDT.SPOT.SIGNAL DEXEUSDT.SPOT.SIGNAL
We have a Spot signal for DEXE:
Entry: $15 - $17
Target: $28 - $32
Hold Time: Follow the new upward signal on the Weekly (W) timeframe
Note: Currently, the Weekly (W) is forming a bottom, nearly completing the process—just a little more time needed to finalize it.
Good luck!

Short term DEXE move...might see a short term DEXE move up here on the 15m tf...
this is not financial advise please do your own research.

Good moment for Buy DEXEGood moment for Buy DEXEUSDT. Possible attempt to exit the sideways trend. We are focusing on a small target. But we can also sit on the breakout of local highs. Good risk\reward ratio. Will see..

Long Entry Signal for DEXE/USDT Based on the daily chart for DEXEUSDT on Bybit, here's a concise analysis:
MLR vs. SMA: The MLR (blue) is above the SMA (pink), indicating a bullish trend.
MLR vs. BB Center: The MLR is above the BB Center Line (orange), suggesting bullish momentum.
PSAR: The PSAR dots (black) are under the price, confirming a bullish trend.
Price vs. SMA 200: The price is above the 200-period SMA (red), supporting a long-term bullish trend.
Current Strategy: Since all entry conditions for a long position are met (MLR above SMA, MLR above BB Center, PSAR under price, price above SMA 200), you might consider entering a long position.
Stop Loss (SL): Set the stop loss at the current level of the PSAR dots to manage risk.
Monitor My Idea: Keep monitoring my idea for any changes in trend or for potential profit-taking opportunities.

DEXEUSDT shortHere is a short trade set-up for DEXEUSDT.
Entry: 20.85
SL: 23.35
TP1: 12.50
TP2: 7.50
Given the significant price movements, be prepared for potential volatility. Implement a stop-loss order to mitigate potential losses. For long positions, a stop-loss below the identified support level is advisable. For short positions, a stop-loss above the recent high can help manage risk.

Dexe (DEXE) Buy Opportunity: Strong Fundamentals & Growth PotentDescription:
Dexe (DEXE) is a decentralized social trading platform designed to empower users to replicate the strategies of top-performing traders autonomously. Built on Ethereum and integrated with cross-chain compatibility, Dexe Network offers a trustless ecosystem where users retain full control of their assets while leveraging advanced DeFi tools. The platform’s fundamentals are anchored in its growing adoption, innovative governance model, and robust tokenomics.
Fundamentals Overview:
- **Ecosystem Growth:** Dexe has expanded its offerings to include decentralized portfolio management, staking, and DAO governance, attracting a loyal user base.
- **Cross-Chain Integration:** Support for multiple blockchains enhances accessibility and scalability, positioning DEXE as a versatile player in the DeFi space.
- **Token Utility:** The DEXE token fuels governance, staking rewards, and fee discounts, creating sustained demand. A deflationary mechanism via token burns further tightens supply.
- **Transparency & Security:** As a non-custodial platform, Dexe mitigates counterparty risks, aligning with DeFi’s core ethos.
- **Strategic Partnerships:** Collaborations with leading DeFi projects and exchanges bolster liquidity and user acquisition.
Why Consider DEXE?
The project’s focus on democratizing trading expertise through automation and decentralization aligns with rising demand for passive income solutions. Recent updates, including enhanced UI/UX and expanded asset support, signal proactive development. With a low market cap relative to its potential, DEXE presents asymmetric upside for long-term investors.
Disclaimer:
Cryptocurrency trading carries significant risk and may result in partial or total loss of capital. The volatile nature of crypto markets means prices can fluctuate dramatically within short periods. This post is **not financial advice**—conduct your own research (DYOR) and assess your risk tolerance before trading. Dexe’s performance depends on broader market conditions, regulatory changes, and project execution. Never invest funds you cannot afford to lose. Consult a financial advisor if uncertain.
Stay disciplined, trade responsibly.

DEXE/USDTKey Level Zone: 21.700 - 22.200
HMT v5 detected. The setup looks promising, supported by a previous upward/downward trend with increasing volume and momentum, presenting an excellent reward-to-risk opportunity.
HMT (High Momentum Trending):
HMT is based on trend, momentum, volume, and market structure across multiple timeframes. It highlights setups with strong potential for upward movement and higher rewards.
Whenever I spot a signal for my own trading, I’ll share it. Please note that conducting a comprehensive analysis on a single timeframe chart can be quite challenging and sometimes confusing. I appreciate your understanding of the effort involved.
Important Note :
Role of Key Levels:
- These zones are critical for analyzing price trends. If the key level zone holds, the price may continue trending in the expected direction. However, momentum may increase or decrease based on subsequent patterns.
- Breakouts: If the key level zone breaks, it signals a stop-out. For reversal traders, this presents an opportunity to consider switching direction, as the price often retests these zones, which may act as strong support-turned-resistance (or vice versa).
My Trading Rules
Risk Management
- Maximum risk per trade: 2.5%.
- Leverage: 5x.
Exit Strategy
Profit-Taking:
- Sell at least 70% on the 3rd wave up (LTF Wave 5).
- Typically, sell 50% during a high-volume spike.
- Adjust stop-loss to breakeven once the trade achieves a 1.5:1 reward-to-risk ratio.
- If the market shows signs of losing momentum or divergence, ill will exit at breakeven.
The market is highly dynamic and constantly changing. HMT signals and target profit (TP) levels are based on the current price and movement, but market conditions can shift instantly, so it is crucial to remain adaptable and follow the market's movement.
If you find this signal/analysis meaningful, kindly like and share it.
Thank you for your support~
Sharing this with love!
HMT v2.0:
- Major update to the Momentum indicator
- Reduced false signals from inaccurate momentum detection
- New screener with improved accuracy and fewer signals
HMT v3.0:
- Added liquidity factor to enhance trend continuation
- Improved potential for momentum-based plays
- Increased winning probability by reducing entries during peaks
HMT v3.1:
- Enhanced entry confirmation for improved reward-to-risk ratios
HMT v4.0:
- Incorporated buying and selling pressure in lower timeframes to enhance the probability of trending moves while optimizing entry timing and scaling
HMT v4.1:
- Enhanced take-profit (TP) target by incorporating market structure analysis
HMT v5 :
Date: 23/01/2025
- Refined wave analysis for trending conditions
- Incorporated lower timeframe (LTF) momentum to strengthen trend reliability
- Re-aligned and re-balanced entry conditions for improved accuracy
