SHORT TERM BUY / LONG TERM SHORTPrice has been in a flag pattern that looks like it should break to the upside but another converging triangle within the channel shows a break below the range. Putting the two patterns together shows a tight trading range first to the upside and then a continuation back down in a break and retouch
0.30 AED
1.21 B AED
3.52 B AED
3.00 B
About DUBAI INVESTMENTS
Sector
Industry
CEO
Khalid Jassim Mohammed bin Kalban
Website
Headquarters
Dubai
Founded
1995
ISIN
AED000601016
FIGI
BBG000CMNZC1
Dubai Investments PJSC provides real estate services.The firm engages in the development of real estate for sale and leasing; contracting activities; manufacture and trade of products in various sectors; and investment in bonds, funds, and equity securities. It operates through the following segments: Property; Investments; and Manufacturing, Contracting, and Services.The Property segment covers the development of real estate for sale and leasing. The Investments segment comprises of strategic minority investments in associates, investment banking, asset management, and financial investments.The Manufacturing, Contracting, and Services segment produces and sells materials used in construction projects, executing construction contracts, production of raw and architectural glass, cooling services, production, aluminum extruded products, laboratory furniture, healthcare, and education.The company was founded on July 16, 1995 and is headquartered in Dubai, United Arab Emirates.
Related stocks

DIC 1hr frame possible scenarioDIC 1hr frame possible scenario if it did not brake the 2.25 then there is a chance to continue to visit the previous top 2.40

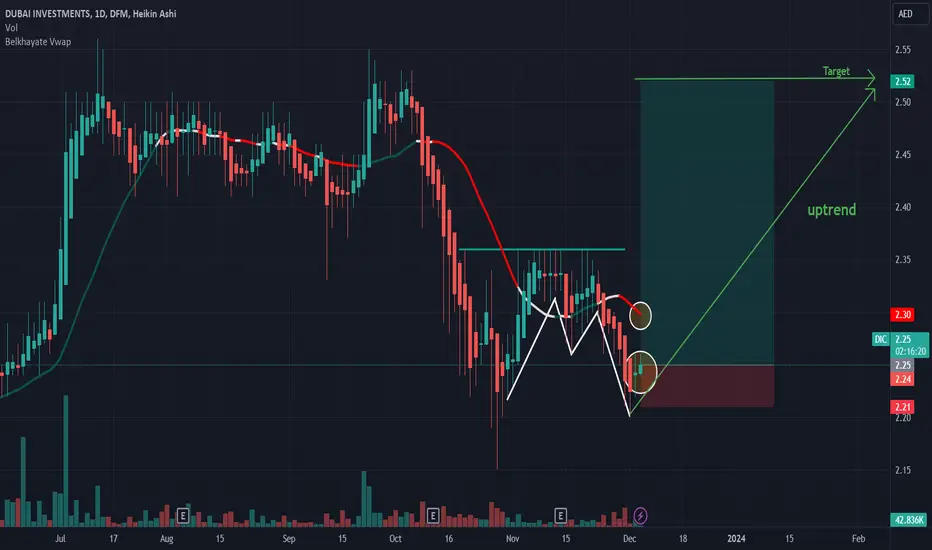
DIC: Buy ideaOn DIC we will have a hight probability to have an uptrend because as you see on the chart we are under the vwap and also we have a candle with small body and long wick.Thanks!

Symmetrical triangle with a big opportunity to go long looks very interesting and as the market is on a rising trend expect a swing Hight and low in the range between 2.2 and 2.4
watch for a break signal if so will jump to the 2.75 and up

Go for itDIC is now starting a fresh up trend, from here there are very good chances it will fill up the gap that it created earlier. No harm in buying some quantities now and keeping it in portfolio. It also pays good dividends.
Hit like & follow guys ;)

Stuck in a RangeA uptrending stock is stuck within a range I am waiting for a breakout to buy. Lets be patient being in cash is also a position.
Hit like & follow guys ;)

Get Set & GO!!Its ready for another big move if you missed it earlier here is the chance to buy DIC and make some money. I think coming week it will try to fill up the gap so still there is some juice remaining for us. Very Bullish!!
Hit like & follow guys :)

where will be the breakoutYes over all its very positive but now going side ways even i am holding this trade for about 4 days now. They will soon announce financial results and hopefully it will be positive. I am waiting for my target!!
Hit like & follow guys ;)

Watchout!!Watchout a strong resistance is at 2.65 but there are good chances it will break as dividends are up and after that i will gap down. It can go down till 2.40 once the dividends are given out. Over all very bullish and in a strong uptrend. Its good time to buy but lets book the profit before the D da

See all ideas
Summarizing what the indicators are suggesting.
Neutral
SellBuy
Strong sellStrong buy
Strong sellSellNeutralBuyStrong buy
Neutral
SellBuy
Strong sellStrong buy
Strong sellSellNeutralBuyStrong buy
Neutral
SellBuy
Strong sellStrong buy
Strong sellSellNeutralBuyStrong buy
An aggregate view of professional's ratings.
Neutral
SellBuy
Strong sellStrong buy
Strong sellSellNeutralBuyStrong buy
Neutral
SellBuy
Strong sellStrong buy
Strong sellSellNeutralBuyStrong buy
Neutral
SellBuy
Strong sellStrong buy
Strong sellSellNeutralBuyStrong buy
Displays a symbol's price movements over previous years to identify recurring trends.
Curated watchlists where DIC is featured.

Frequently Asked Questions
The current price of DIC is 2.94 AED — it has decreased by −0.68% in the past 24 hours. Watch DUBAI INVESTMENTS stock price performance more closely on the chart.
Depending on the exchange, the stock ticker may vary. For instance, on DFM exchange DUBAI INVESTMENTS stocks are traded under the ticker DIC.
DIC stock has risen by 3.16% compared to the previous week, the month change is a 16.21% rise, over the last year DUBAI INVESTMENTS has showed a 42.72% increase.
We've gathered analysts' opinions on DUBAI INVESTMENTS future price: according to them, DIC price has a max estimate of 2.47 AED and a min estimate of 2.47 AED. Watch DIC chart and read a more detailed DUBAI INVESTMENTS stock forecast: see what analysts think of DUBAI INVESTMENTS and suggest that you do with its stocks.
DIC stock is 2.41% volatile and has beta coefficient of 0.31. Track DUBAI INVESTMENTS stock price on the chart and check out the list of the most volatile stocks — is DUBAI INVESTMENTS there?
Today DUBAI INVESTMENTS has the market capitalization of 12.50 B, it has increased by 2.53% over the last week.
Yes, you can track DUBAI INVESTMENTS financials in yearly and quarterly reports right on TradingView.
DIC net income for the last quarter is 170.89 M AED, while the quarter before that showed 554.87 M AED of net income which accounts for −69.20% change. Track more DUBAI INVESTMENTS financial stats to get the full picture.
Yes, DIC dividends are paid annually. The last dividend per share was 0.18 AED. As of today, Dividend Yield (TTM)% is 6.12%. Tracking DUBAI INVESTMENTS dividends might help you take more informed decisions.
DUBAI INVESTMENTS dividend yield was 8.33% in 2024, and payout ratio reached 63.49%. The year before the numbers were 5.36% and 46.99% correspondingly. See high-dividend stocks and find more opportunities for your portfolio.
EBITDA measures a company's operating performance, its growth signifies an improvement in the efficiency of a company. DUBAI INVESTMENTS EBITDA is 622.80 M AED, and current EBITDA margin is 17.23%. See more stats in DUBAI INVESTMENTS financial statements.
Like other stocks, DIC shares are traded on stock exchanges, e.g. Nasdaq, Nyse, Euronext, and the easiest way to buy them is through an online stock broker. To do this, you need to open an account and follow a broker's procedures, then start trading. You can trade DUBAI INVESTMENTS stock right from TradingView charts — choose your broker and connect to your account.
Investing in stocks requires a comprehensive research: you should carefully study all the available data, e.g. company's financials, related news, and its technical analysis. So DUBAI INVESTMENTS technincal analysis shows the buy rating today, and its 1 week rating is buy. Since market conditions are prone to changes, it's worth looking a bit further into the future — according to the 1 month rating DUBAI INVESTMENTS stock shows the buy signal. See more of DUBAI INVESTMENTS technicals for a more comprehensive analysis.
If you're still not sure, try looking for inspiration in our curated watchlists.
If you're still not sure, try looking for inspiration in our curated watchlists.