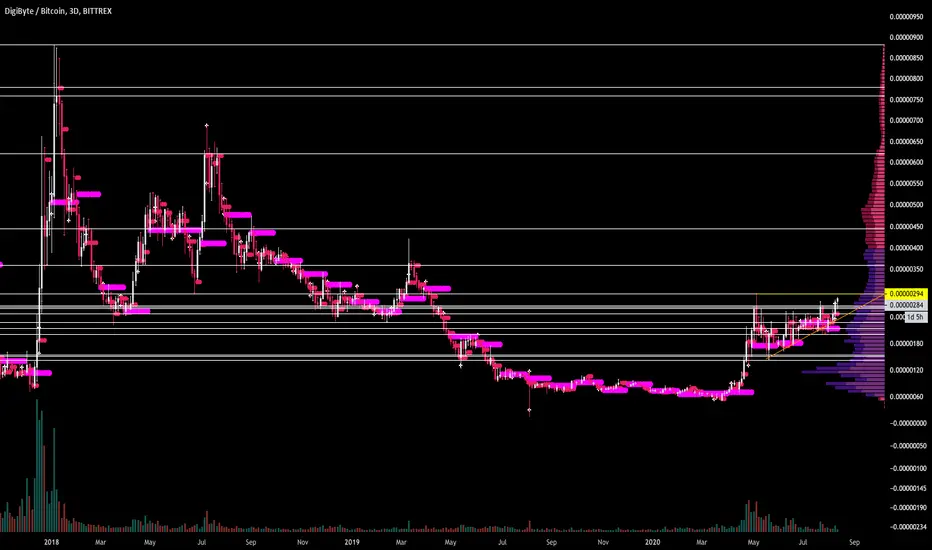
DigiByte (DGB) Uptrend Intact (80%+ Mapped Short-Term)We just saw another shakeout take place while DigiByte (DGBBTC) retraced after a new peak was hit.
Let me tell you that the uptrend is still intact.
Today we ended up with a higher low for DGBBTC compared to 21-May.
Right now we have early signals developing in favor of the bulls.
We have above-average volume coming in.
A strong bounce taking place just above EMA200.
Higher low (just mentioned).
The MACD starting to curve.
Strong RSI.
For your convenience, I marked the next target short-term... That is within 1-4 weeks.
This target can also be hit mid-term, which goes from 1-3 months.
Of course, the charts are always changing and can always change and that's why you need a plan before you trade.
If you have any questions feel free to leave a comment.
This is Alan Masters.
Thanks a lot for your continued and amazing support... I love you! 🤗
Namaste.
DGBBTC trade ideas


DigiByte (DGB) Another Wave To The Upside Is ExpectedHi friends hope you are doing good and welcome to the new update on Digibyte coin. In my previous article I showed you that the price action of Digibyte coin was at the support of an up channel. The price line of DGB is moving within this channel since April 2020. This time I was expecting that the price action will breakout the resistance. Finally the priceline started the bullish move but failed to breakout the resistance and now moving down at the support again. This was almost 50% rally.
The strong support of SMAs at the support of channel:
This time there are more strong chances that the price action will be bounced to the up side from the support of this channel and it will make another attempt to breakout the resistance. Because after placing the simple moving averages with the time period of 100 and 200 we can observe that the 100 simple moving average is almost at the same level where we have the support of the channel as well. The 200 simple moving average is also below the support of this up channel.
A bullish Butterfly move:
At the support of this channel the price action has also completed the formation of the bullish Butterfly pattern on the small-time period 6-hour chart. Let's dig this pattern deeper to see how perfect this pattern is driven.
After initial leg the A to B leg is retraced between 0.618 to 0.786 Fibonacci then B to C leg is projected between 0.382 to 0.886 Fibonacci projection of A to B leg then C to D leg is retraced between 1.27 upto 1.618 Fibonacci and here we have all legs driven as required for perfect bullish butterfly.
Now the priceline is entered in potential reversal zone of this pattern and from here the priceline can move up at any time.
The priceline is geared up from the PRZ level as predicted last year:
Now I would like to recall my previous post that I shared over a year ago in June 2019 when I predicted that the price action of DGB is forming a bearish Shark pattern and soon it will start the formation of C to D leg. I also showed the pivot support in the potential reversal zone of this bearish Shark pattern. And using this support the price action could start a powerful long term rally to the upside.
This idea had potential to produce up to 1400% big bullish move. Now it can be easily observed that as predicted the price action has geared up from the pivot support and the potential reversal zone of this bearish Shark pattern and so far it has produced more than 396% profit.
I am sharing the sell targets again that I have defined as per Fibonacci sequence of beraish Shark as below:
Sell targets:
Secure sell targets:
Sell between: 0.00000338 to 0.00000694
Aggressive targets:
Sell between: 0.00000808 to 0.00000969
Conclusion:
On the long term the price action is in bullish momentum but if we move to the daily chart then the price action is at the support of channel. Even though we have very strong supports of the channel and the moving averages as well therefore this report can be critical as well because if this strong support will be broken down then a short time rally can be started to the downside.


DigiByte (DGB) Strongly Bullish, Out Of Consolidation TriangleDigiByte (DGBBTC) is out of the consolidation triangle and is looking strongly bullish.
After prices peaked 6-May, DigiByte remained really strong.
The classic retrace hit a low 21-May and after this date, we've only seen higher lows.
Printing slow but steady growth, which is a signal of strength, DGBBTC moved back above all EMAs and is now aiming to break the last high.
With a very strong RSI... The next move can be equally strong... The next target is marked on the chart.
Namaste.

$DGB #DGB could be in for a dropDigibyte has not broken and closed below this trend line in a few months. Might be some bearish action vs BTC in Digibyte's future

DGB DigiByte Bonfire Squared UPDATEPlease find original chart for more information on how to read the current pattern and how to use this to add confluence.


DGB/BTC Broke its 3 years old downtrendBITTREX:DGBBTC is still under radar ,worth considering it, it might pump hard as before.


DGB DigiByte Bonfire SquaredTrue squared to price (short term) 1 hr price action built off Bonfire. Levels and Pivots to watch for confluence. DGB has already made up a ton of ground percentage wise but it's currently still ok if it can rebound drops near this price, and or avoid long standing drops altogether. This is a different DGB than we have seen in the past. More volume and more steam.

DGBBTC Easy 65%Multi month consolidation. Broke through resistance and Currently retesting support. Getting ready for next leg up. Will be fast. Don't miss it!
Risk: Low
Stoploss: 262


DGB/BTCHi Members!
This is our new strategy for accumulate BTC,
Coin : DGB/BTC
Exchange: Binance
OCO Entry Zone: 0.00000284 - 0.0000030
Target 1 : 0.00000325 (10%)
Target 2 : 0.00000357 (20%)
Target 3 : 0.00000409 (37%)
Target 4 : Raise your personal stop lost
OCO Stop Loss : 0.00000234
Comments: This is our new strategy for accumulate BTC, we use Binance exchange for this strategy, because we need to set a OCO

DGB-BTC: Ascending triangle breakoutHello,
I posted this ascending triangle on DGB some days back, today we see DGB moving nicely after breaking out of this pattern.
My first target remains at 355 sat, after that 420 Sat is good level for Take profit.
Happy and safe trading...
Chao...

Here I buy DigiByte and DGB will go upHere I buy DigiByte
and DigiByte will go up.
The price is testing the major resistance, so now I load my bags and the bullish breakout will start.
And DigiByte will go up.
See you up there

DGB possible Ascending TriangleA potentially Ascending Triangle shown on $DGBBTC awating breakout as confirmation.
We can only call it an Ascending Triangle when it gets confirmed by breakout, and entering early is more riskier than you think.
Hang tight there and be patient.


$DGB seems ready for a great move$DGB is drawing a great pattern
On Daily, 100 / 200 MA holds
Ascending triangle on long time chart
$DGB could make a great move
Not a financial advice
