$DGB MARKET INDICATORcan you see what the difference is between a bear market and a bull market?
its not complicated
but there is that crowd of people who run around saying the sky is falling
why do you think they do that?
just a moment of silence
not financial advice
DGBUSD trade ideas

DGB Headed Back To The 52 Week Low And A 90% Drop To 0.01Title says it all do your own DD DO NOT SHORT THIS NAME in this crazy Crypto world This is not advice

Holds and buy the dipDigibyte get setback and delay lately from continuing upwards after the Bitcoin had the recent correction of 20% down. Digibyte has the potential of growing up 100% up to 0.19- 0.20 in the near short term. As we see we have Digibyte fall from the 0.15 area to 0.10 now touching the major support line of 0.097 but did not cross it. Also we have the trend is going into a falling wedge witch near the end now.
Falling wedge is a Bullish pattern, so I expect the breakouts should happen at some point soon. in the event of DGB fall again, the next major support line is 0.0823. This could happen if the Bitcoin continue falling.
So what we are looking for now is DGB to get out of the falling wedge and also the descending wedge right after.
Good luck!
Please trade at your own risk.

THE JOURNEY OF $DGBdigibyte is only now beginning to breach the area of the 2018 ATH
the journey is just beginning
expecting price action to fall in the triangle for the next several months
NOT FINANCIAL ADVICE

Next target is 0.19Digibyte is expecting to go sideways between 0.14 and 0.148 until it get squeezed by the end of the descending triangle within the rising wedge with an upside of 25% to reach the 0.19
Trade at your own risk.

DGB should be going upMy first idea. DGB has been slowly creeping up from .13 to .15 cents.
Possible move to .18-ish cents in the near future; or even retest of ATH.
A little bird told me Coinbase listing for ZIL and DGB could be in the works.
Considering this coin was .002 cents a few months back, I am expecting to see further growth.
Cheers and may we all manifest a bunch of wealth

Digibyte is doing what is supposed to do BUY the dip, oversold on the hourly chart. expect a rise upwards within the rising wedge and towards the 0.19 and take a profit there.... Trade at your own risk.


Digibyte is going through a consolidations periodThe picture speak by it self, Digibyte is going through consolidations into that falling channel.
Trade at your own risk.

DGB slight cool off before next runDGB RSI and MACD appears to need a recovery and decline over the next few 4H candles.
look for support at the following fib levels: 0.786 & then 0.618.
Depending on RSI and MACD may find ultimate support at lower RED support line.
IMO I will look to enter around 0.618 and RED trend line ($0.10 - $0.12) range.
DGB is a great opportunity.
Good luck
That path is a potential short term target before new ATH, maybe around $0.20

Digibyte is about to 3x (theta-like run eminent)After following theta's mega-run over the past few months, I decided to take a glance at the chart. Lo and behold, there appears to be some stunning similarities when compared to Digibyte.
This little fractal may be indicating that Digibyte is about to follow theta's moves and do a theta-like run up to around 50 cents.
Yes, 50 cents.
Additionally, Digibyte is so undervalued that its market cap 50 cents would still be well under $10 billion. In other words there is a lot of room to grow. I expect Digibyte to be trading for up to $2-$3 at some point during this market cycle.
Stay tuned.
Keep an eye on trading volume as well. The 24 hour trading volume on Digibyte is currently sitting close to 50% of its total market cap...Something to think about...
(not financial advice ;)

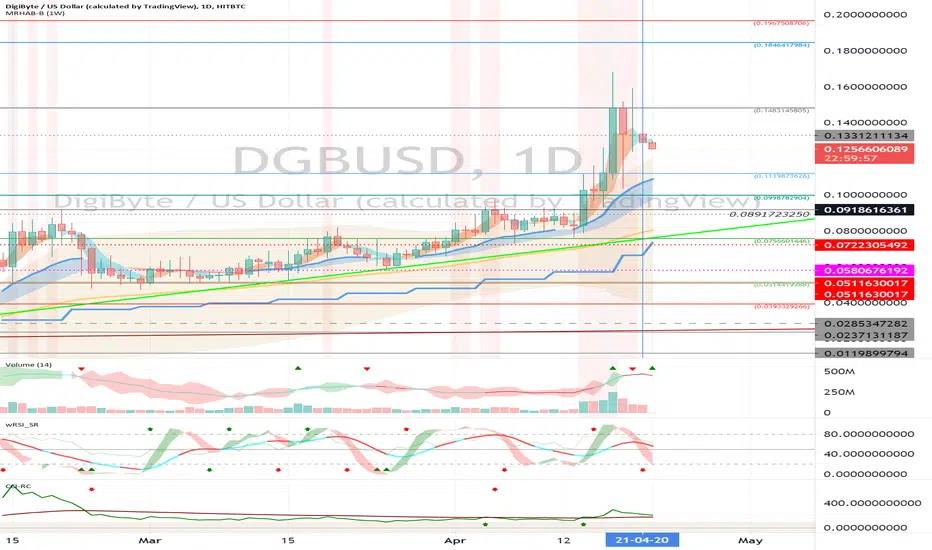
DigiByte (DGB) - April 21Hello?
Dear traders, nice to meet you.
By "following" you can always get new information quickly.
Please also click "Like".
Have a good day.
----------------------------------
(DGBUSD 1W chart)
(1D chart)
You should watch for any movement that deviates from the 0.1119873626-0.1483145805 section.
If it falls at 0.0756601446, you need a Stop Loss to preserve profit or loss.
If the CCI line falls below the EMA line in the CCI-RC indicator, volatility may occur, so careful trading is necessary.
-------------------------------------
(DGBBTC 1D chart)
It remains to be seen if it can rise along the uptrend line even with support at the 221 Satoshi point.
-------------------------------------------------- -------------------------------------------
** All indicators are lagging indicators.
So, it's important to be aware that the indicator moves accordingly with the movement of price and volume.
Just for the sake of convenience, we are talking upside down for interpretation of the indicators.
** The wRSI_SR indicator is an indicator created by adding settings and options from the existing Stochastic RSI indicator.
Therefore, the interpretation is the same as the conventional stochastic RSI indicator. (K, D line -> R, S line)
** The OBV indicator was re-created by applying a formula to the DepthHouse Trading indicator, an indicator that oh92 disclosed. (Thank you for this.)
** Check support, resistance, and abbreviation points.
** Support or resistance is based on the closing price of the 1D chart.
** All explanations are for reference only and do not guarantee profit or loss on investment.
Explanation of abbreviations displayed on the chart
R: A point or section of resistance that requires a response to preserve profits
S-L: Stop Loss point or section
S: A point or segment that can be bought for profit generation as a support point or segment
(Short-term Stop Loss can be said to be a point where profits and losses can be preserved or additionally entered through installment transactions. It is a short-term investment perspective.)
GAP refers to the difference in prices that occurred when the stock market, CME, and BAKKT exchanges were closed because they do not trade 24 hours a day.
G1: Closing price when closed
G2: Cigar at the time of opening
(Example) Gap (G1-G2)

DGB BREAKOUT PENDINGon the weekly chart
from the bottom of the demand zone to the top on record volume
macd histogram going positive
signal line crossing
.03 is the breakout level

DGB - Just started buying this oneBased solely on the technicals, I'm starting to trade this one. Could be a gem, could be a turd. Guess we'll see.


DGB LEVELING UPlooks like .40 is on the table
price action seems to be heading towards next fib channel level
good luck hodlers!
the ride looks like it is about to start!


cup and handle + triangle patternDGB is making cup and handle + triangle pattern
BITTREX:DGBUSD
BINANCE:DGBUSD
BINANCE:DGBUSDT

Buy limit DGB @$0.040 Target @$1.00 Date Sept 21, 2022 Digitbyte Token
Buy limit DGB @$0.040 Target @$1.00 Date Sept 21, 2022
Buy limit DGB @$0.036 Target @$1.00 Date Sept 21, 2022
Buy limit DGB @$0.033 Target @$1.00 Date Sept 21, 2022
DigiByte is an open-source and highly decentralized global blockchain
that hosts DGB Coin, DigiAssets, Digi-ID and more.
Project Website: digibyte.io
The live DigiByte price today is $0.056506 USD with a 24-hour trading volume of $78,157,335 USD.
DigiByte is down 3.76% in the last 24 hours. The current CoinMarketCap ranking is #82,
with a live market cap of $797,368,508 USD. It has a circulating supply of 14,111,241,610 DGB coins
and a max. supply of 21,000,000,000 DGB coins.
Coin Market Cap: coinmarketcap.com

Short term outlook for DigibyteDigibyte seems to be ready for another move to the upside here.
It has been consolidating nicely since hitting 9 cents a few weeks ago.
In the bigger picture, DGB has been moving sideways for almost 4 years and is ready for an explosive move soon. Remember, price discovery mode kicks in around 14 cents so be ready for a huge impulse wave up after achieving new a new all-time-high.
The speculative short-term forecast here is based off a recent fractal that dgb seems to be repeating. Time will tell.
(not financial advice ;)
