DigiByte Update · Optimistic New ATH · 1000%, 2800% & 4500%I will explain everything. The technical analysis, why I believe DigiByte can grow beyond 2,700%, and the overall Cryptocurrency market conditions.
Good evening my fellow Cryptocurrency trader, I hope you are having a wonderful day.
First, let me tell you that DigiByte (DGBUSDT) is fully bullish c
Related pairs
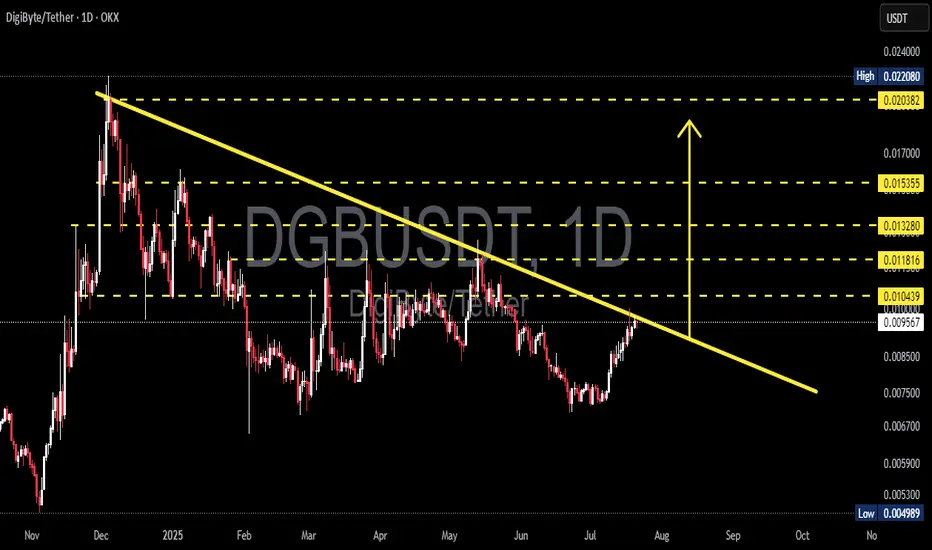
DGBUSDT 1D#DGB has broken above the descending resistance and the SMA200 on the daily chart. It is also on the verge of breaking out above the Ichimoku Cloud. If a breakout occurs, the targets are:
🎯 $0.01186
🎯 $0.01349
🎯 $0.01512
🎯 $0.01745
🎯 $0.02041
⚠️ Always use a tight stop-loss and practice proper ris

DGBUSDT Ready to Explode? Major Breakout from 7-Month Downtrend📉 Pattern: Falling Wedge / Descending Triangle Breakout
DigiByte (DGB) is currently showing a high-probability breakout from a descending trendline that has held price action in check since December 2024. This structure hints at weakening selling pressure while buyers have started forming higher lo
DGB SLEEPINGa NICE CUP AND HANDLE looks to be forming but let's see where this goes!
Once we get a upward motion and break .018 we can see some serious moves
We need to start seeing more use cases for DGB come on Jared !

DGB/USDT – Preparing for a Rebound from a Historical Demand Zone
🔍 Pattern and Structure Analysis
The DGB/USDT pair is currently testing a historical demand zone in the 0.00550 – 0.00733 USDT area (highlighted in yellow). This zone has proven to be a strong bounce area since mid-2022. The price structure is forming a large double bottom in this support zone, in

DGBUSDT 1W AnalysisDGB ~ 1W Analysis
#DGB Buy back gradually from this support block with a short term target of at least 20%+ from here.

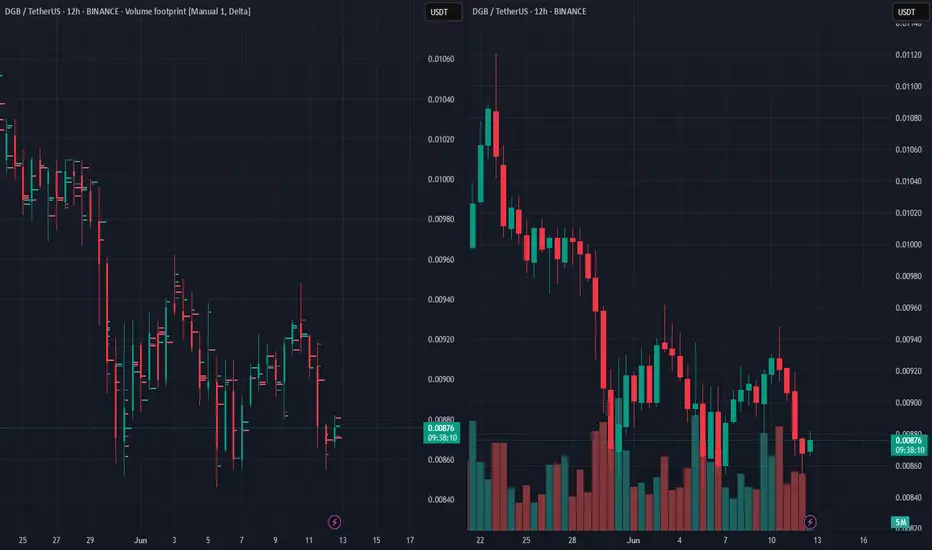
SPOT DGB LONG 12.06.2025Pinning after abnormal purchases.
💰I enter at the market price.
I'll let you know when I record it manually.
‼️Risk per trade: 1% of the allocated funds for spot trading.
Thank you!
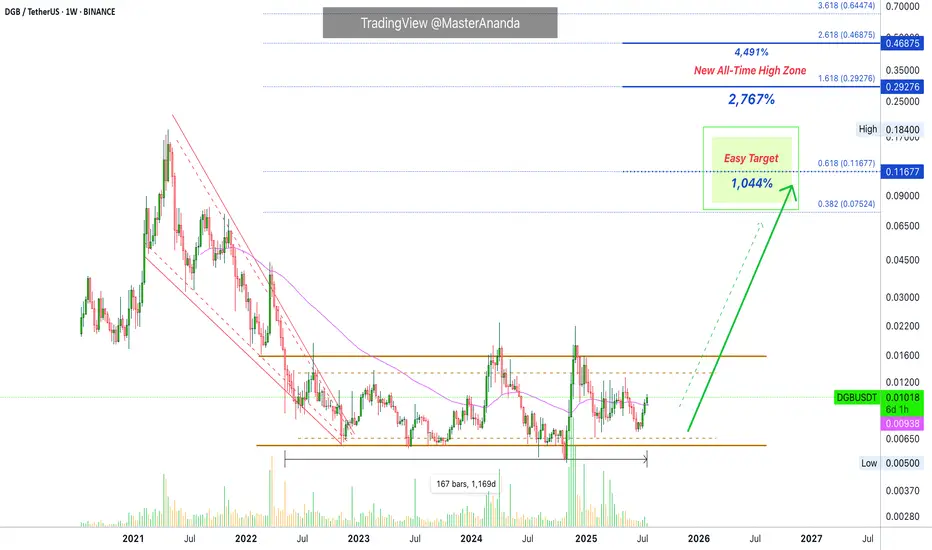
DigiByte 3 Years Consolidating; New All-Time High In Dec. 2025June 2022, literally. Actually, in May 2022 DigiByte enters the current price range. In fact, the low in May 2022 was the exact same price we have now. This means three full years of sideways action, consolidation.
This sideways action is not a bearish development but bullish. The only time when vo

DGB 2nd breakout Successfully breakout this resistant line with a short -term target of at least +10%

DigiByte Will Launch The 2025 Bull Market (2,753% Or 4,479% ???)Just for context. After a strong decline between mid-2019 and March 2020, DigiByte produced a 7,000%+ bullish wave. The cycle peaked in April 2021 and the rise had a duration of 413 days. A year and two months.
This info opens up some questions and gives fuel for some speculation:
» Will DigiByte

See all ideas
Summarizing what the indicators are suggesting.
Oscillators
Neutral
SellBuy
Strong sellStrong buy
Strong sellSellNeutralBuyStrong buy
Oscillators
Neutral
SellBuy
Strong sellStrong buy
Strong sellSellNeutralBuyStrong buy
Summary
Neutral
SellBuy
Strong sellStrong buy
Strong sellSellNeutralBuyStrong buy
Summary
Neutral
SellBuy
Strong sellStrong buy
Strong sellSellNeutralBuyStrong buy
Summary
Neutral
SellBuy
Strong sellStrong buy
Strong sellSellNeutralBuyStrong buy
Moving Averages
Neutral
SellBuy
Strong sellStrong buy
Strong sellSellNeutralBuyStrong buy
Moving Averages
Neutral
SellBuy
Strong sellStrong buy
Strong sellSellNeutralBuyStrong buy
Displays a symbol's price movements over previous years to identify recurring trends.
Frequently Asked Questions
The current price of DGB / TetherUS (DGB) is 0.00928 USDT — it has fallen −3.49% in the past 24 hours. Try placing this info into the context by checking out what coins are also gaining and losing at the moment and seeing DGB price chart.
DGB / TetherUS price has fallen by −1.77% over the last week, its month performance shows a 24.47% increase, and as for the last year, DGB / TetherUS has increased by 24.06%. See more dynamics on DGB price chart.
Keep track of coins' changes with our Crypto Coins Heatmap.
Keep track of coins' changes with our Crypto Coins Heatmap.
DGB / TetherUS (DGB) reached its highest price on Jun 24, 2023 — it amounted to 0.04040 USDT. Find more insights on the DGB price chart.
See the list of crypto gainers and choose what best fits your strategy.
See the list of crypto gainers and choose what best fits your strategy.
DGB / TetherUS (DGB) reached the lowest price of 0.00300 USDT on Jun 14, 2023. View more DGB / TetherUS dynamics on the price chart.
See the list of crypto losers to find unexpected opportunities.
See the list of crypto losers to find unexpected opportunities.
The safest choice when buying DGB is to go to a well-known crypto exchange. Some of the popular names are Binance, Coinbase, Kraken. But you'll have to find a reliable broker and create an account first. You can trade DGB right from TradingView charts — just choose a broker and connect to your account.
Crypto markets are famous for their volatility, so one should study all the available stats before adding crypto assets to their portfolio. Very often it's technical analysis that comes in handy. We prepared technical ratings for DGB / TetherUS (DGB): today its technical analysis shows the buy signal, and according to the 1 week rating DGB shows the buy signal. And you'd better dig deeper and study 1 month rating too — it's buy. Find inspiration in DGB / TetherUS trading ideas and keep track of what's moving crypto markets with our crypto news feed.
DGB / TetherUS (DGB) is just as reliable as any other crypto asset — this corner of the world market is highly volatile. Today, for instance, DGB / TetherUS is estimated as 2.63% volatile. The only thing it means is that you must prepare and examine all available information before making a decision. And if you're not sure about DGB / TetherUS, you can find more inspiration in our curated watchlists.
You can discuss DGB / TetherUS (DGB) with other users in our public chats, Minds or in the comments to Ideas.