DGB [DigiByte]* Please share your opinion in the comments.
* This is just an idea, Not financial advice.
DGBUSDT trade ideas

DGB to $6 and beyond..DGB, great idea looks like next move is to 0.06..
All time high near 0.18 its getting exciting now

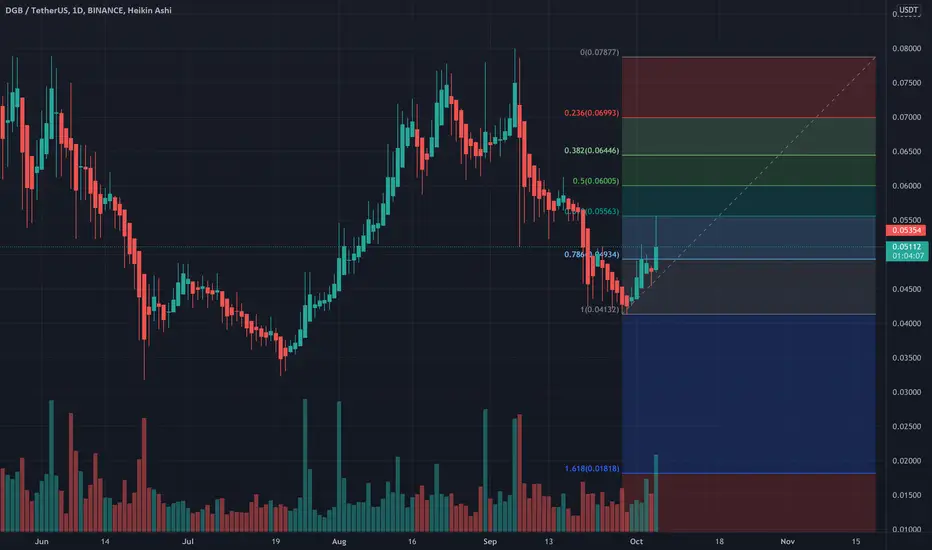
#1st Target DGB1st target: $0.10
Re-Enter To: $0.06981
The project is sleeping. The target is valid for the next month.
Good luck. Not investment advice.

How to use ssl supertrend and support and resistance at a sameHow to use ssl supertrend and support and resistance at a same time


dgb ki lankalanka lag sakti hai till 0.5 best of my knowledge... chacha ki hesab market ur sakta hai..
target jan ka hai... apna kaam banta, mooj mein rhay janta

DGBUSDT In Great PositionDGB in investment position .. currently DGB is in very strong support, down the channel, POC of Volume and will fly soon, this position is very safe, only 5% stop loss is recommended

DGB/USDTIt is suitable for entering these areas as a staircase. Thank you for your support friends and these analyzes are personal opinions that I share with you. I hope you are profitable. I will never announce an exit point because everyone must have their own profit strategy.

DGBUSDT PUMP!!DBGUSDT Chart set up is almost identical to SFPUSDT and BELUSDT
Weekly indicators are also confirming a Huge move to the upside.


The time has come or DGBAfter the btc movement it s time to release DGB. I am gonna hodl it until december.

DGB/USDT SHORT TRADE SETUPExpecting a 10% to 15% drop in DGB. MA's making a bearish crossover and broke below it.
Enter at CMP ($0.04853)
SL: $0.05053
Target: 10% to 15%.
Note: This is not financial advice. I have done my own research and trading at my own risk. So, do your own research before investing.

DGB first target hit .. promising future with this oneAs mentioned earlier Idea. its playing out just as expected.
One of my strongest holds and great solid team and community.
DGBUSDT is testing the daily resistance 🦐DGBUSDT is testing the daily resistance. IF the price is going to have a breakout, According to Plancton's strategy (check our Academy ), we can set a nice order
–––––
Follow the Shrimp 🦐
Keep in mind.
🟣 Purple structure -> Monthly structure.
🔴 Red structure -> Weekly structure.
🔵 Blue structure -> Daily structure.
🟡 Yellow structure -> 4h structure.
⚫️ Black structure -> <4h structure.

Digibyte - Current PostureA review of the posture of Digibyte, following the completion of three corrections, printing three successively higher-lows.
In terms of Elliott Wave analysis, there are two interpretations:
DGB has now completed a Wave 4 and commenced a Wave 5; or
DGB has completed a Wave 2 and just commenced a Wave 3.
Either case is bullish and is well supported by the MACD crossing bullish and the RSI sitting comfortably in neutral territory. Looking at the the Fibonacci projection of the correction on this standard scale chart and two targets present themselves:
$0.278 at the 1.618 resistance line
$0.336 at the 2.0 resistance line
Of course there are higher levels, but they will become exponentially less likely the longer DGB remains under $0.185.
What do you think? How high can DGB rally to complete this next impulse wave higher?

Blue skies ahead for DGBWill keep updating, this is not the exact entry price, look into lower time frame for perfect entry.

DGB to 0.18-0.30 by November 21st 2021. Lets goooA prediction for DGB coin for the next two months. I expect it will go to 0.18-0.30 within two months iA if not before.

DGBUsdt Good PositionDGB can going up and have chanse for pump
after big fall this have great chanse for back up with powerfull candle
so close too prize before going up on bullmarket so can again back up and break all tops
but need patient and wait and little HODL
GL
EntryPoint:
0.04375
Supports:
0.04094
0.03328
0.02702
Resistance:
0.4865
Targets:
0.05323
0.06238
0.07310
0.09163
0.12211
0.17595
0.21294
0.28007
GL guys


Digibyte breakout to moon soonDGB back to top 100 soon :@
BUY FROM : 0.045 TO 0.0463
TP1: 0.05
TP2: 0.06
TP3: OPEN
STOP LOSE : close candel 4H down 0.043
GOOD LCUK TO ALL :)

DGB/USDT SELL SIGNALThe market has been tricky the last couple of weeks, providing a relatively wide range trading for most cryptocurrency pairs. However, sooner rather than later the range trading will be over. The DGB price action is much weaker than most coins, thus it can be dumped further during the next week.

🆓DigiByte (DGB) Sep-19 #DGB $DGBThe selling pressure on DGB is weakening so in next days DGB could recover to 0.065$ zone or even pump strongly to 0.08$ and 0.1$ zone. So in this period, we will keep accumulating DGB at 2 support zones : 0.05$ and 0.055$ zones. But if it loses 0.05$ zone it will fall down to 0.04$ zone
📈BUY
🔴Buy : 0.0538-0.0562$
🔴Buy : 0.0488-0.0512$. SL if B
🔴Buy : 0.0635-0.0665$ if A. SL if B
📉SELL
🔴Sell : 0.0635-0.0665$. SL if B
🔴Sell : 0.078-0.082$. SL if B
🔴Sell : 0.0975-0.1025$. SL if B
♻️BACK-UP
🔵Sell : 0.0488-0.0512$ if B. SL if A
🔵Buy : 0.039-0.041$. SL if B
❓Details
📈Red Arrow : Main Direction as BUY and SELL section
📉Blue Arrow : Back-Up Direction as BACK-UP section
🟩Green zone : Support zone as BUY section
🟥Red zone : Resistance zone as SELL section
🅰️A : The Close price of 1-day candlestick is Above the zone
🅱️B : The Close price of 1-day candlestick is Below the zone

DGB below resistance#DGBUSDT
$DGB rejected from resistance zone, and it is trading below descending resistance, also it is still above a support zone that is between 0.618 and 0.786 fib of last swing high.
#DGB price needs to break out from descending resistance zone to start a new rally.
if price going to make a AB=CD pattern, the long term target can be $0.2, which is 250% increase from here.
