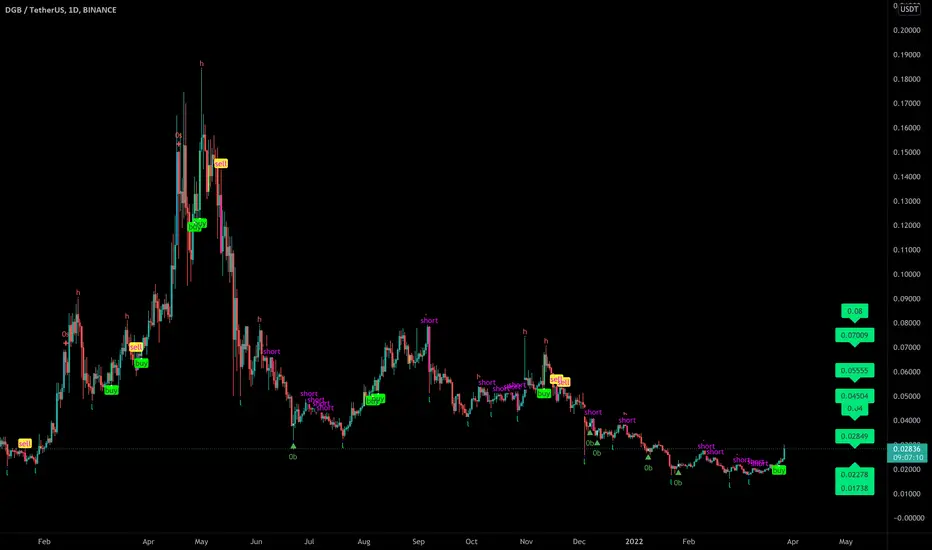
DGB 3 day chart looking Fantastic!DGB 3 day chart looks to make a move
upward. DeMark 9 reads we may of hit
bottom. Look at the yellow line price targets
on the right and look for DGB to make a
retracement move up to the Golden Pocket.
DGBUSDT trade ideas

DGB- good wedge formationHello everyone
The bear channel of DGBUSDT is turning into a wedge pattern ( tight one)that shows a possible reversal or a steady bull channel formation in the next few days.
On 4 hours chart however,we can see a small bear flag pattern and a possible head and shoulders pattern, which shows, that market can touch the support level ( 0.0225$)and come back and go up to resistance level 0.027$.
P.S. : Wedge pattern is more likely to have a reaction,because of higher time frame , and volume.


DGB/USDT TRADE SETUP! BREAKOUT!!Hello everyone, if you like the idea, do not forget to support with a like and follow.
Welcome to this DGB/USDT TRADE setup. DGB looks good here.
DGB is breaking out from the bull flag-like structure and ready to pump. Buy some now and add more in dips.
Entry range:- $0.258-$0.268
Target1:- $0.31
Target2:- $0.36
Target3:- $0.40
Target4:- $0.44
SL:- $0.238
Use low leverage 2x-4x
If you like this idea then do support it with like and follow.
Also, share your views in the comment section.
Thank You!

BREAKOUTDGB BREAKOUT
If my blue line doesnt break by the candle, the price may reach up to $0.03200 as my highest target
if my blue line breaks possible first drop $0.026, and waiting for another breakout fall down to $0.024
Im waiting from my side to go on an uptrend buy.

DGB Bullish setup This asset has the potential to start a swing for following targets
Recommend for 5 % of your spot portfolio

DGBUSDT 4H Analysis: 04.19.2022If the price can consolidate itself over R-S zone ($ 0.025), the rising of price up to $ 0.28 would be expected.
If you liked this idea or having your own opinion about it, I would be glad if you write it down in the comment section.
👤 Yazdan Ganjabi: @YazdanGanjabiTrading
📅 19.Apr.22
⚠️(DYOR)

DGB almost ready for next leg upDGB is sitting the top median line of the downtrend red Pitchfork. There are two resistance zones above with the next major price target marked by the yellow sloped rectangle.

IS DGB READY FOR NEXT PRIME 80% MOVE !!Welcome to this quick DGB//USDT analysis.
I have tried my best to bring the best possible outcome in this chart.
Hello, members welcome to DGB/USDT quick chart analysis by CRYPTOSANDERS.
At first, smash the like button and follow,
this motivates me to bring this kind of analysis to you all let’s get back to the chart.
As we can see in the above-mentioned chart that DGB/USDT is currently trading inside the triangle pattern and above the red, yellow, and blue MA.
So here we are expecting a break out soon, and for taking positions we should wait for the confirmation which will be the the retest of upper trend line after the break out.
If it moves down and breaks down the lower trend line then this chart will be invalidated.
Entry:-$0.03410,$0.03510
Target:-50% to 80%
Stop-loss:-$0.03299
with leverage 5x to 10x
Sorry for my English it is not my native language.
Remember:-This is not a piece of financial advice. All investment made by me is at my own risk and I am held responsible for my own profit and losses. So, do your own research before investing in this trade.
Do hit the like button if you like it and share your charts in the comments section.
Thank you.

Bullish movement spottedDash looks bullish but hiting a previous support now turn resistance (what should we be looking for) wait till break of the position then it will continue bullish RSI.

DGB/USDT TRADE SETUPDGB in USDT pair looks bullish. The breakout and retest look good and now it may possibly bounce 26% from the current entry-level.
Entering this trade between $0.0344 to $0.0363.
SL at $0.03346
Targets:
$0.0381
$0.0405
$0.0422
$0.0434
Accumulate this coin if it dips, use max 5x to 10x leverage, and do not FOMO.
Note: This is not financial advice. This trade setup is based on my T.A and I am risking my own money on this trade. I am reliable for my own losses and profits. So, trade as per your preference.

DGB/USDT TRADE SETUP! READY TO PUMP 65% Hi guys, This is CryptoMojo, One of the most active trading view authors and fastest-growing communities.
Do consider following me for the latest updates and Long /Short calls on almost every exchange.
I post short mid and long-term trade setups too.
Let’s get to the chart!
I have tried my best to bring the best possible outcome in this chart, Do not consider it as financial advice.
LONG #DGB/USDT
ENTRY: $0.03447 to 0.03570
SELL- 50% to 60%
LEVERAGE: 5X
STOP LOSS: $0.033
This chart is likely to help you in making better trade decisions, if it did do consider upvoting this chart.
Would also love to know your charts and views in the comment section.
Thank you

DGB/USDT Analysis #TheCryptoCityDGB/USDT Analysis
Everything Is On The Chart.
Everything depends on the BTC movement
#TheCryptoCity

DGD/USDT TRADE SETUP! READY TO PUMP 65% LONGHi guys, This is CryptoMojo, One of the most active trading view authors and fastest-growing communities.
Do consider following me for the latest updates and Long /Short calls on almost every exchange.
I post short mid and long-term trade setups too.
Let’s get to the chart!
I have tried my best to bring the best possible outcome in this chart, Do not consider it as financial advice.
LONG #DGB/USDT
ENTRY: $0.0347 to 0.034
SELL- 50% to 60%
LEVERAGE: 5X
STOP LOSS: $0.033
This chart is likely to help you in making better trade decisions, if it did do consider upvoting this chart.
Would also love to know your charts and views in the comment section.
Thank you


Bullish Butterfly IdeaBullish butterfly. Short-term bearish, Mid-term Bullish. XABCD completes the 1.272 at around 2.1 cents. Completing the harmonic and reversing here would be the most ideal scenario because if the 1.272 doesn't hold. Then the next target to complete the harmonic would be 0.005 cents. (half a penny) This would be the most bearish scenario, but would still satisfy the bullish butterfly pattern to take us back around 6-7 cents.
Im hoping 2.1 cents holds and we reverse heavily to the upside.

DigiByte vs Tether Will Also Grow Strong (140%)We know that DigiByte and Siacoin move together...
We know that both DGBBTC and SCBTC are both bullish right now.
We already looked at SCUSDT recently and we have left DGBUSDT; here it is.
Chart Signals
We have the "Adam & Eve" pattern which we looked at before.
We also have other bullish signals, like the reversal candle February 24.
We also have a bullish cross of EMA10 and EMA50 and the very strong RSI is the confirmation of this all.
The more bullish signals we have, the stronger the bullish case becomes.
You can find some targets and even support levels on the chart.
Namaste.

DGB is getting ready to start.DGB with leaving its short-term downtrend, And with a lot of liquidity coming in, if it can break the red line, it could go up to $ 0.06. But RSI indicator, I expect it reacts to the by approaching the resistance line.

Digibyte pumpDigiByte (DGB) is a highly scalable peer-to-peer digital currency that enables industry-leading transaction speeds with negligible fees.
Next Zil ?
DIGIBYTE/usdt Redy for take ofHigh potential for long position with low risk in spot and future
DGBUSDT Kucoin
Entry point is down area of triangle


DGB showing bullish signs Using the Supertrend + EMA200 strategy, all entry conditions are met and the stop loss should be set at the bottom line of the super trend indicator.

DigiByte vs Tether (Good Potential 4 Growth)We have many signals on the DGBUSDT chart for the long-term, good potential.
Let's start with the weekly now:
- We have the bottom pattern (multiple).
- TD Count.
- Wave count.
Looking at the daily chart, we can see a broken downtrend while prices moving above EMA10 and EMA21.
We've been having bullish consolidation as prices creep up slowly...
We have low volume, but after 7 consecutive green candles we can say that DGBUSDT is getting ready to grow.
Namaste.
Note: Remember to have a plan before you trade.
