DIA: Falling Wedge Bullish Breakout Confirmed (295% - 545% Pot.)My dear reader, here we have a pair that is going bullish for the first time in years... DIABTC.
The relevant pattern for this pattern is the falling wedge. The falling wedge is a bullish reversal pattern and tends to show up at the bottom of a trend.
The bearish trend is long and wide. The falling wedge is a small and steep.
The falling wedge pattern leads to a new All-Time Low, mid-August, and the ATL session produced a long lower wick on low volume.
This week we have a bullish breakout from a small consolidation pattern and the highest buy volume since March 2024. All these are a combination of reversal and bullish signals.
This can translate into the change from a downtrend to an uptrend. An uptrend signals long-term growth. Potential targets on the chart.
Thank you for reading.
Namaste.
DIABTC trade ideas

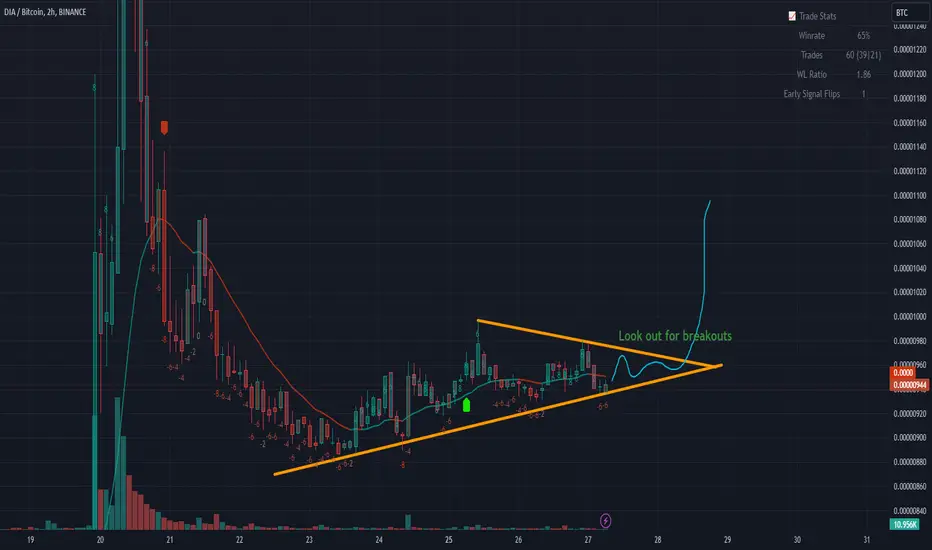
DIABTC ascending triangle, breakout soonHi there, DIA/BTC is forming an ascending triangle that signals bull run soon, keep an eye for that one for breakouts for long.
Entry at 0.00000940 seems fine, if we get breakout of this triangle we may reach 0.00001080 in a first run, possible even higher if market allows it.
As always use stop loss just in case
DIA trend reversal (inverse hammer)We can see DIA has gained some strength in the last 24 hours vs BTC. Also while btc dropped dia went up. This W shape recovery may play out.
-Targets on chart
-Signals on chart

$DIA trying to reclaim level lost since may
DEGO pumped maybe this is the next D to move
invalidation below 200

$DIA broke out rejected from supply zone
most likely retest of break out zone then proceed to flip yellow line for continuation
weekly stoch just crossed to the up side and H4 and daily bullish

$DIA/$BTCprepare for explosion.
I think we are in an arc and from it's base we are going to shoot upwards


$DIA/BTC 2D (Binance Spot) Bug falling wedge on supportDecentralised Information Asset looks bottomed here, we expect that dip to be the last then finally start the reversal.
Current Price= 0.00002656
Buy Entry= 0.00002665 - 0.00002405
Take Profit= 0.00004054 | 0.00005321 | 0.00007541
Stop Loss= 0.00001927
Risk/Reward= 1:2.5 | 1:4.58 | 1:8.23
Expected Profit= +59.92% | +109.90% | +197.48%
Possible Loss= -23.98%
Fib. Retracement= 0.382 | 0.559 | 0.786
Margin Leverage= 1x
Estimated Gain-time= 6 months
Website: www.diadata.org
Contracts:
#ERC20 0x84ca8bc7997272c7cfb4d0cd3d55cd942b3c9419
#BEP20 0x99956d38059cf7beda96ec91aa7bb2477e0901dd

DIA formed bullish Gartley | A good long oppottunityHi dear friends, hope you are well and welcome to the new trade setup of DIA token with BTC pair.
On a 4-hr time frame, DIA has formed bullish Gartley pattern.
Note: Above idea is for educational purpose only. It is advised to diversify and strictly follow the stop loss, and don't get stuck with trade

DIA What is the next ?!Someone buys quantities of currency, as an accumulation for periods of time that spanned more than a month
Maybe we will see soon
200% or more !

DIA token formed bullish Gartley for upto 37.5% pumpHi dear friends, hope you are well and welcome to the new trade setup of DIA token with BTC pair.
Previously I shared a trade plan of DIA with USD pair, which is still in play:
Now on a 4-hr time frame chart, DIA has formed a bullish Gartley pattern.

DIABTC short term BULLISH After breaking out of the downtrend DIABTC looks to head higher. But trade with caution and do your own research!

DIA BTC pair - A big move expected - pumping dumping tokenDIA BTC pair - A big move expected - pumping dumping token

DIA$DIA doing very well in the sea of red. Impeccable strenght. BTC chart shows it. Some fib levels for potential supports and entry levels.
enjoy

DIA looks to be bottomed...I might take some time to really lift off, but the risk reward seems healthy.


DIA/BTC buy opportunityHi followers,
DIABTC Formed nice double bottom, buyers took control, formed higher low with attempt to break higher.
There is a potential move up.
Don't forget to manage your risk! 👌
Good luck and trade with care 🙏
If you like my content - 👍 Like, 💬 comment, 👆 follow and 👉 share!
❗❗❗
Disclaimer: This information is not a recommendation to BUY or SELL. It is to be used for educational purposes only!

DIAWhen the cryptomarket actually recognizes fundamental projects or Oracles actually pump. Maybe never idk.

DIA / BTCThis one is a very bad performer. Some big twitter accounts are still shilling it though. I do expect an uptrend soon.

DIA on the rise, +18% profitThe setup on 4h TF was at the price of 0.0000383
The trade slowly went forward and our 12h TF setup was activated. We are using multiple time frames to determine our entrys, so we moved to 12h TF and now following the trade on the 12h TF. The trade was updated, we had our TP at 0.0000451
The trade went our way and hit TP for a nice +18% profit!!!
Trade closed, ₿₿₿₿₿ in the bag!
Trade safe and wait for our next setup!

DIABTC Is testing the 0.5 Fibonacci level 🦐DIABTC Is testing the 0.5 Fibonacci level below the weekly resistance. IF the price is going to have a breakout, According to Plancton's strategy (check our Academy ), we can set a nice order
–––––
Follow the Shrimp 🦐
Keep in mind.
🟣 Purple structure -> Monthly structure.
🔴 Red structure -> Weekly structure.
🔵 Blue structure -> Daily structure.
🟡 Yellow structure -> 4h structure.
⚫️ Black structure -> <4h structure.

DIA, In a Low Risk Area !DIA is in a strong support area. Buying here has low risk with an excellent risk/reward ratio. RSI in daily has already reached the oversold area ( <30 ) and now we can expect it to start moving ahead to 70. Try to accumulate it with low risk and hold it with patience. Potential support and resistance zones have mentioned on the chart.

DIABTC Another DIA analysis.
Previous one was right on +60% when returning back to equilibrium, cash in some profits.
Be aware of these support and resistance levels.
There is no real hard resistance level on the way up so a good risk to reward ratio!
