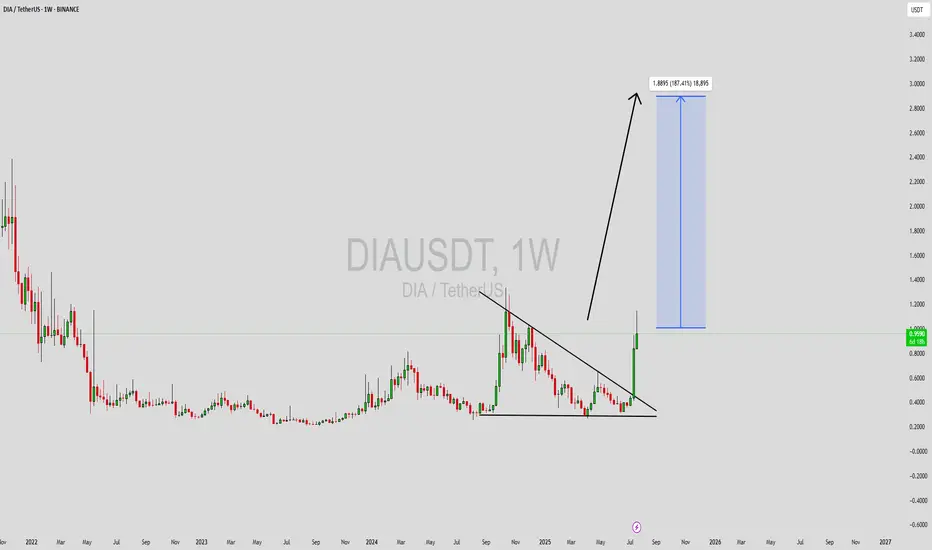
DIAUSDT Forming Powerful BreakoutDIAUSDT (DIA/USDT) has just completed a powerful breakout from a long-standing descending triangle pattern on the weekly timeframe. This move signals a potential shift from accumulation to expansion as bulls regain control. The breakout is accompanied by a significant surge in trading volume, suggesting that both retail and institutional investors are beginning to accumulate positions in anticipation of a broader rally. Technically, the pattern break targets a potential upside of 140% to 150%, supported by historical resistance levels shown on the chart.
DIA, a decentralized oracle platform, plays a vital role in bridging off-chain data to blockchain networks. As the DeFi space continues to expand, reliable data oracles like DIA are gaining increased relevance. This fundamental strength, combined with the bullish technical setup, makes DIA a solid candidate for medium- to long-term portfolio consideration. The recent price action could be the beginning of a major trend reversal, especially as on-chain metrics show growth in active wallet interaction.
The structure of the current breakout also reflects a clean technical progression—multiple higher lows leading into resistance, followed by a strong breakout candle with volume confirmation. If DIA can hold above its breakout level and establish support, the next leg higher could be rapid. The market sentiment is clearly shifting as more market participants recognize DIA's potential in the growing Web3 infrastructure.
✅ Show your support by hitting the like button and
✅ Leaving a comment below! (What is You opinion about this Coin)
Your feedback and engagement keep me inspired to share more insightful market analysis with you!
DIAUSDT trade ideas
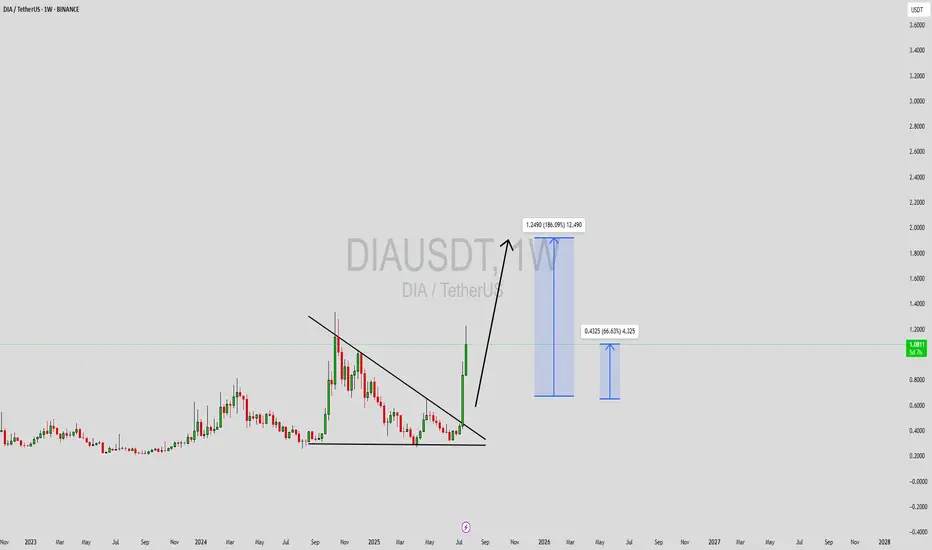
DIAUSDT Forming Descending ChannelDIAUSDT has recently broken out of a well-defined descending channel pattern on the weekly timeframe, signaling the start of a major bullish reversal. This breakout, accompanied by a strong surge in volume, suggests that buying momentum is entering the market decisively. The DIA token, which underpins the DIA data oracle platform, is starting to gain traction again as attention shifts toward real-world DeFi infrastructure and decentralized data solutions.
Technical indicators further support the bullish thesis. After consolidating within the descending channel for several months, the breakout candle has closed above resistance with conviction, pointing to a shift in sentiment. Projections based on technical targets suggest an upside potential ranging from 140% to 150%, with the possibility of price reaching as high as $2.50 in the coming months if momentum sustains. The long accumulation phase visible on the chart strengthens the case for this extended rally.
The market has also shown a renewed interest in fundamental oracles and trusted data feeds, which puts DIA back in the spotlight. As DeFi protocols evolve, the role of decentralized data becomes increasingly critical—positioning DIA to benefit from this narrative. With investor interest returning and the token breaking structure on the macro chart, DIA is now on many traders’ watchlists.
✅ Show your support by hitting the like button and
✅ Leaving a comment below! (What is You opinion about this Coin)
Your feedback and engagement keep me inspired to share more insightful market analysis with
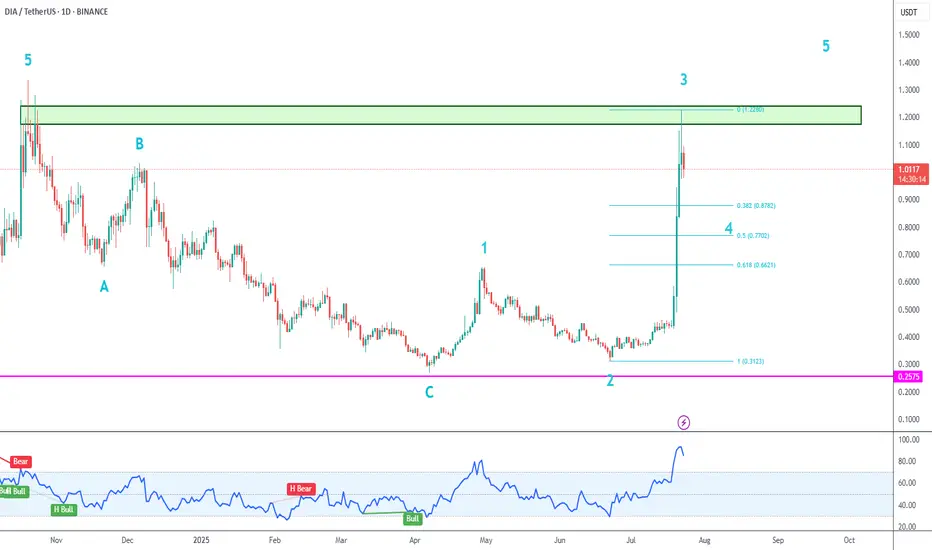
DIA Motive Wave➡️ After confirming blue wave C, price is making a motive wave with sub-waves 1 and 2 complete.
➡️ Price is initially being held by the gray supply zone, which dates from October 2024.
➡️ This high could have marked the end of wave 3. Pullbacks are buying opportunities, but I prefer to see at least a 38.2% pullback for wave 4 before looking for new long trades.
DIA/USDT Analysis: High Probability of Correction
This asset has experienced a trend break and a breakdown of the ascending trendline. A volume cluster has formed above the current price, which triggered the current correction. If these levels are retested and met with a reaction, we consider a short position with a potential target of $0.9.
Sell Zone: $1.125–$1.2
This publication is not financial advice.
DIAUSDT: Trend in daily timeframeThe color levels are very accurate levels of support and resistance in different time frames, and we have to wait for their reaction in these areas.
So, Please pay special attention to the very accurate trend, colored levels, and you must know that SETUP is very sensitive.
Be careful
BEST
MT

A strategic, short-term bullish trade driven by the USDT.D!This DIA/USDT long position is a strategic, short-term bullish trade driven by the USDT.D distribution pattern on the 45-minute timeframe, signaling a potential altcoin rally. DIA’s strong fundamentals, including its transparent data sourcing, DeFi adoption, and cross-chain compatibility, make it a compelling choice for this trade. While we remain long-term bearish on the crypto market due to macroeconomic and cycle risks, this trade serves as a hedge to capture short-term upside while aligning with our broader strategy.

DIAUSDT buy opportunityDIAUSDT is displaying a well-defined cup and handle pattern, with the price successfully breaking above the neckline and currently retesting this zone as a healthy pullback.
The immediate buy zone serves as a strategic entry point, aligning with the continuation of the bullish structure. The wave progression outlined on the chart guides the trajectory toward the ultimate setup target, which aligns with the projected sell-off zone.
Share your insights and perspectives on this coin's potential.

Trend Analysis for DIA/USDT### 📈 **Trend Analysis for DIA/USDT**
#### 1. **Current Trend:**
* DIA is in a **potential early-stage uptrend**, coming off a **long accumulation zone**.
* Price is **breaking out of a downtrend channel**, or at least testing the top of a sideways range that’s lasted for months.
* There’s a noticeable **shift in momentum upward**, likely supported by increased volume (though volume isn’t fully visible in the chart snapshot).
#### 2. **Structure Observations:**
* After bottoming out, DIA has started forming **higher lows**.
* It is now testing a **key horizontal resistance zone** — if broken, this could confirm the start of a bullish trend.
* Looks like it may be forming a **rounded bottom or cup-like structure**, which is often a sign of accumulation completing.
#### 3. **Key Levels:**
* **Resistance:** Around \$0.60–\$0.70 — strong horizontal resistance from previous rejection levels.
* **Support:** Around \$0.35–\$0.40 — recent higher low zone.
* A confirmed breakout above \$0.70 with volume could open the way toward **\$1+**, a psychological and technical target.
---
### 🟢 Summary:
DIA is **looking bullish in the early stages**, with signs of accumulation and breakout potential. A weekly close above the \$0.70 zone could be the signal that the macro trend is shifting from accumulation to expansion.
Here’s what could **invalidate the bullish scenario** for DIA/USDT and delay or cancel the \$1+ target:
---
### ❌ **Bearish or Invalidating Scenarios**
#### 1. **Failure to Break Resistance (\~\$0.60–\$0.70)**
* If DIA repeatedly gets rejected at this zone and starts closing **lower weekly highs**, it would signal **bullish exhaustion**.
* This would suggest that buyers aren’t strong enough yet, and the breakout was a **false signal**.
#### 2. **Loss of Support (\~\$0.40)**
* A clean breakdown below \$0.40 with volume could invalidate the current uptrend.
* This would shift the bias from accumulation to potential **re-distribution or continuation of the bear market**.
#### 3. **Volume Divergence**
* If price rises but **volume decreases**, it may indicate **weak hands driving the move**, and a correction could follow.
#### 4. **Macro Market Risk**
* If Bitcoin or Ethereum correct sharply, DIA (like many altcoins) could follow due to broader market pressure, regardless of its own chart setup.
#### 5. **Fakeout Structure**
* If DIA breaks out above \$0.70 but quickly retraces back into the range, that would be a **bull trap**, often followed by strong downside.
---
### 🛑 Summary:
The \$1+ projection **depends on holding support and breaking resistance** with sustained buying volume. Watch for **weekly closes**, volume confirmation, and Bitcoin’s behavior as key leading signals.

DIA/USDTKey Level Zone: 0.5370 - 0.5420
HMT v6 detected. The setup looks promising, supported by a previous upward/downward trend with increasing volume and momentum, presenting an excellent reward-to-risk opportunity.
HMT (High Momentum Trending):
HMT is based on trend, momentum, volume, and market structure across multiple timeframes. It highlights setups with strong potential for upward movement and higher rewards.
Whenever I spot a signal for my own trading, I’ll share it. Please note that conducting a comprehensive analysis on a single timeframe chart can be quite challenging and sometimes confusing. I appreciate your understanding of the effort involved.
Important Note :
Role of Key Levels:
- These zones are critical for analyzing price trends. If the key level zone holds, the price may continue trending in the expected direction. However, momentum may increase or decrease based on subsequent patterns.
- Breakouts: If the key level zone breaks, it signals a stop-out. For reversal traders, this presents an opportunity to consider switching direction, as the price often retests these zones, which may act as strong support-turned-resistance (or vice versa).
My Trading Rules
Risk Management
- Maximum risk per trade: 2.5%.
- Leverage: 5x.
Exit Strategy
Profit-Taking:
- Sell at least 70% on the 3rd wave up (LTF Wave 5).
- Typically, sell 50% during a high-volume spike.
- Adjust stop-loss to breakeven once the trade achieves a 1.5:1 reward-to-risk ratio.
- If the market shows signs of losing momentum or divergence, ill will exit at breakeven.
The market is highly dynamic and constantly changing. HMT signals and target profit (TP) levels are based on the current price and movement, but market conditions can shift instantly, so it is crucial to remain adaptable and follow the market's movement.
If you find this signal/analysis meaningful, kindly like and share it.
Thank you for your support~
Sharing this with love!
HMT v2.0:
- Major update to the Momentum indicator
- Reduced false signals from inaccurate momentum detection
- New screener with improved accuracy and fewer signals
HMT v3.0:
- Added liquidity factor to enhance trend continuation
- Improved potential for momentum-based plays
- Increased winning probability by reducing entries during peaks
HMT v3.1:
- Enhanced entry confirmation for improved reward-to-risk ratios
HMT v4.0:
- Incorporated buying and selling pressure in lower timeframes to enhance the probability of trending moves while optimizing entry timing and scaling
HMT v4.1:
- Enhanced take-profit (TP) target by incorporating market structure analysis
HMT v5 :
Date: 23/01/2025
- Refined wave analysis for trending conditions
- Incorporated lower timeframe (LTF) momentum to strengthen trend reliability
- Re-aligned and re-balanced entry conditions for improved accuracy
HMT v6 :
Date : 15/02/2025
- Integrated strong accumulation activity into in-depth wave analysis

DIA 8H Chart Downtrend
Following up on my previous analysis, the downtrend is still strong, and I expect another leg down.
The upside grind has the look and feel of a bear flag, and there is no RSI divergence on the recent low.
The gray descending trendline could serve as resistance.

DIA / USDT looks great, holding to 5 usdt ?DIA is an Ethereum token that governs Decentralized Information Asset (DIA), an open source Web3 data and oracle platform. This platform allows smart contracts to connect to external data sources, such as DeFi market data and centralized APIs. DIA can be used to propose and vote on platform upgrades. Lasernet is DIA.
World’s First Oracle Rollup
Access oracle data trustlessly and permissionlessly, via a rollup chain engineered for oracles.
Celková ponuka: 168,81M DIA
Maximálna ponuka: 200M DIA
Obehová ponuka: 119,67M DIA
Take Profit (TP):
1.7 usdt
3.4 usdt
5 usdt
Good entry now or over 0.25 usdt.
This is only my idea guys.
This is not financial advice !
Please do your analysis and consider investing !! Thanks for supp.

DIAUSDT Analysis: Volume Spike with a Strong Demand ZoneDIAUSDT Analysis: Volume Spike with a Strong Demand Zone
Daily Volume Increase: DIAUSDT shows a significant 96% spike in daily volume, indicating heightened interest.
Volume-to-Market Cap Ratio: The 60% ratio suggests active trading relative to its market cap.
Blue Box Entry Zone: The blue box is identified as a meaningful demand zone for potential entries.
Confirmation Checklist:
Before entering, I will look for confirmations using:
Cumulative Delta Volume (CDV)
Liquidity Heatmap
Volume Profile
Volume Footprint
Upward Market Structure Breaks on Lower Time Frames
Additional Insights:
DIAUSDT is showing strong signals, but risk management remains crucial, especially in volatile markets. Entries in the blue box should be approached with confirmation for the best risk-to-reward ratio.
Learn Advanced Techniques:
Want to master entries like this? DM me to learn how to utilize CDV, liquidity heatmaps, volume profiles, and volume footprints effectively.
Final Thoughts:
The blue box provides a great entry opportunity for DIAUSDT. Stay patient and precise. Good luck trading!
If you think this analysis helps you, please don't forget to boost and comment on this. These motivate me to share more insights with you!
I keep my charts clean and simple because I believe clarity leads to better decisions.
My approach is built on years of experience and a solid track record. I don’t claim to know it all, but I’m confident in my ability to spot high-probability setups.
If you would like to learn how to use the heatmap, cumulative volume delta and volume footprint techniques that I use below to determine very accurate demand regions, you can send me a private message. I help anyone who wants it completely free of charge.
My Previous Analysis (the list is long but I think it's kinda good : )
🎯 ZENUSDT.P: Patience & Profitability | %230 Reaction from the Sniper Entry
🐶 DOGEUSDT.P: Next Move
🎨 RENDERUSDT.P: Opportunity of the Month
💎 ETHUSDT.P: Where to Retrace
🟢 BNBUSDT.P: Potential Surge
📊 BTC Dominance: Reaction Zone
🌊 WAVESUSDT.P: Demand Zone Potential
🟣 UNIUSDT.P: Long-Term Trade
🔵 XRPUSDT.P: Entry Zones
🔗 LINKUSDT.P: Follow The River
📈 BTCUSDT.P: Two Key Demand Zones
🟩 POLUSDT: Bullish Momentum
🌟 PENDLEUSDT.P: Where Opportunity Meets Precision
🔥 BTCUSDT.P: Liquidation of Highly Leveraged Longs
🌊 SOLUSDT.P: SOL's Dip - Your Opportunity
🐸 1000PEPEUSDT.P: Prime Bounce Zone Unlocked
🚀 ETHUSDT.P: Set to Explode - Don't Miss This Game Changer
🤖 IQUSDT: Smart Plan
⚡️ PONDUSDT: A Trade Not Taken Is Better Than a Losing One
💼 STMXUSDT: 2 Buying Areas
🐢 TURBOUSDT: Buy Zones and Buyer Presence
🌍 ICPUSDT.P: Massive Upside Potential | Check the Trade Update For Seeing Results
🟠 IDEXUSDT: Spot Buy Area | %26 Profit if You Trade with MSB
📌 USUALUSDT: Buyers Are Active + %70 Profit in Total
🌟 FORTHUSDT: Sniper Entry +%26 Reaction
🐳 QKCUSDT: Sniper Entry +%57 Reaction
📊 BTC.D: Retest of Key Area Highly Likely
I stopped adding to the list because it's kinda tiring to add 5-10 charts in every move but you can check my profile and see that it goes on..

DIA Short Trading Plan
▶️I'm watching DIA's 4H chart price action for a short trade targeting 0.5734 (purple line).
▶️A failed retest of the green ascending trendline, with RSI divergence, followed by a lower low in smaller timeframes will be my trigger.

Trading opportunity for DIAUSDTBased on technical factors there is a Buy position in :
📊 DIAUSDT
🔵 Buy Now
🪫Stop loss 0.85
🔋Target 0.62
📏 R/R 1.7
💸RISK : 1%
We hope it is profitable for you ❤️
Please support our activity with your likes👍 and comments📝

DIAUSDT 1WDIA ~ 1W
#DIA If you still have Conviction on this coin,. buy gradually inside this support block,. with a minimum target of 20%+

Hypothetically cup and handleTarget Price Calculation:
- Cup Depth: $1.00 - $0.70 = $0.30
- Target Price: $0.95 + $0.30 = $1.25

$DIAafter the nice pump its chilling here above the 200 ema on the daily in the btc pair
recon we might go for the liquidity below plus 50 ema confluence so got an order there
scaled in already so either way am good
btc.d dominance also reaching a boucne zone imo soon so hope this bubba pumps before that $1.4ish then $1.8ish targets
H4 looks reset

DIAUSDT LONG IDEADIA has reached to 4h demand zone after a drop and now i can see accumulation.in 4h timeframe i can see pin bar and entry bar.so i open long position on DIA .
ENTRY:0.7175
TP1:0.8215
TP2:0.9149
SL:0.6952
R/R:8.81
LEVERAGE:5X

DIAUSDT (DIA) Updated till 17-10-24DIAUSDT (DIA) Daily timeframe range. its absolutely on roll rn. outperforming many alts PA. would be cool if it can get a clean close over 1.1413 that can push it further more easily. recent support at 0.8455.

DIA pump not over yet BINANCE:DIAUSDT pump not over yet dia has breakout from the sideways trend and it if facing rejection from 1.2 resistance price zone, but dia whales are trying hard to maintain its price, #DIA could retest the support below 1$ but overall it is looking bullish dia might hit 1.5$ in coming days, and we might see breakout from this strong resistance price zone and it might go above 2$.

Another 7-star Day from DIAWith good positive volume and frequent Fbuys it was a smooth sailing for DIA.
Now we are on the Sell side.
If the preheat is this way then just imagine what the bull run will be with 7-star
DYOR

DIA.USDT 4HIt has a very good chart for the next jump
We just have to wait for the break formed by the triangle
Give us confirmation

DIA 4H ImpulseAfter completing the green abc correction, DIA seems to have finished waves I and II to the upside, and we could see a solid rise from this level.
