DIAUSDT - Long - Potential 13.67% DIAUSDT - Long - Potential 13.67%
Entry- 2.065
TP1- 2.172
TP2- 2.341
SL- 1.878
- Trigger - Pullback
- BTC - BTC PRICE Increasing, BTC DOM Stable = ALTS Decreasing / Stable
- RR - 1.56
- Trailing Buy - 1%
- Trailing Profit - 1%
- Trailing Stop-Loss - no
DIAUSDT trade ideas

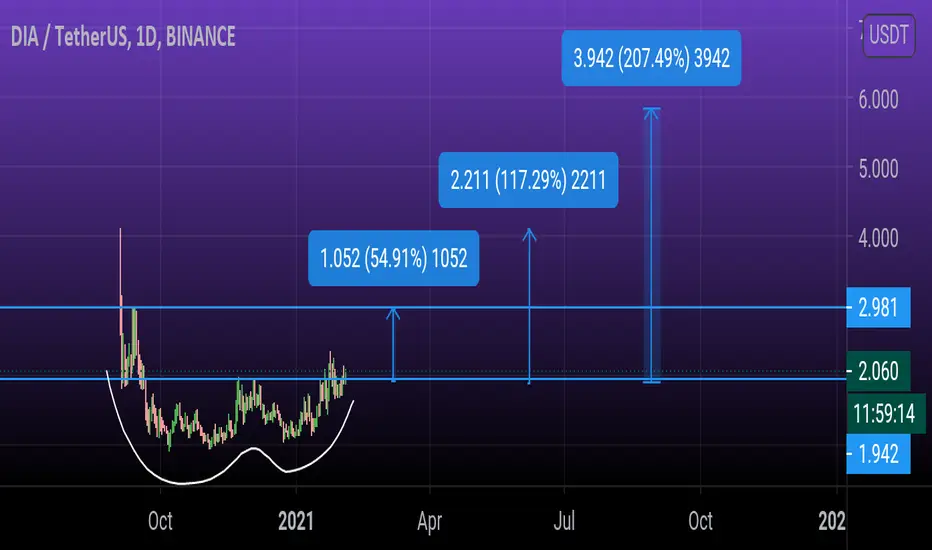
DIA - Don't miss this chanceIt’s preparing to fly and can take off any time. It has made a cup and handle pattern or double bottom anything you say.
Target :- 3-4-5.9
Every defi project has pumped well. Think you are not buying in this dip. You sleep today and might see DIA to moon tomorrow.
#DYOR
Sell this one in May and walk awayWeekly impulse so patients is key here. You can buy it now and hopd it tight to sell in may

Very good project. I m in.Very good price to buy this small cap crypto. Competitors Link and Band. This is really good project and can beat Band so expecting easy 10X from here.

All aboard the DIA train! Get your ticket todayTickets are less than 2$, travel to a new place, get a new experience, save with AirBnB coupon codes and recommendations on the best Dining around.


DIA / USDT (Double bottom)DIA / USDT (report)
One of strong fundamental coins
Double bottom in chart
As long as it hold above this green area its extremely bullish
Long term is great but as i said should hold above this green area
Current price around 1.9$
Potenial next targets 2.1$ - 2.6$ - 3.5$ - 5$ ++
Daily close below green area will turn bearish short term
Make your plan before enter a trade
Best wishes🙏


DIA leading TRBDIA leading TRB
As the title says, DIA is running on the cycle slightly ahead. This creates opportunities obviously.. :) But they are quite in the lockstep movements.
Because of the supply and some of the tokenomics I decided to jump the DIA ship and board TRB instead.. that may have been a dumbass move. One problem is the per token cost of TRB will put off noobs. They'll buy DIA instead as they just get more. But we shall see which prevails.
Seems DIA also uses more of a centralized database within the functionality of their oracle service, which kind of defies the whole point of decentralized oracles. My friend brought this up and it kind of put me off DIA a bit.
Regardless these are two rather obvious oracle small cap plays, which no doubt will pump like crazy at some point in this cycle. They actually have some utility.
glhf


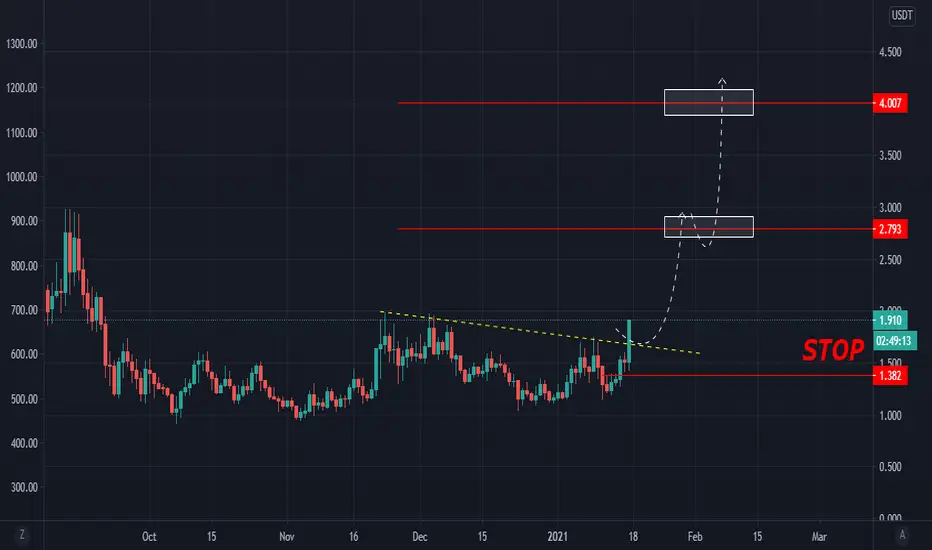
DIA about to break out?I am hoping to see this daily candle wick back below the box and then a lower volume retest of the green line tomorrow, before a big push up with good volume.
The stop can be relatively tight here, so this is a great trade to take.
After the months of accumulation, we will hopefully pop quite high.


Cruicial zone for DIA directionClosely watching this saddle between different support/resistances in the next hour or two to see where DIA wants to go. It has gotten massive rejection candles every time it attempts to stay above 2$, somebody or some people really do not want to let it make a break out yet, wonder how long they can keep batting it down to 1.5 every time before DIA makes a rush at it.

#DIA/USDT - Long - Potential 13.27% #SWING
#DIA/USDT - Long - Potential 13.27%
Entry- 1.748
TP1- 1.872 (75%)
TP2- 1.980 (25%)
SL- 1.625
- Key Notes - BTC can drop at any moment - High Risk Trade
- RR - 1.89
- Trailing Buy - 0.5%
- Trailing Profit - 1%
- Trailing Stop-Loss - no


DIA - Oracle powerIf you did not catch the Chainlink you can still catch the DIA. Buy now for a long term or after the confirmation of the break out.

DIA será q rompe, a flag pode tá malfeita, não tou no PCVou refazer, se não estiver bem feita, não tou no PC q é melhor pra ver.


DIAUSDT - Long - Potential 4.55%DIAUSDT - Long - Potential 4.55%
Entry- 1.824
TP1- 1.907
TP2- 2.032
SL- 1.728
- Key Notes - High chance of BTC drop. Manage Trade!
- RR - 2.14
- Trailing Buy - 0.5%
- Trailing Profit - 1%
- Trailing Stop-Loss - no
