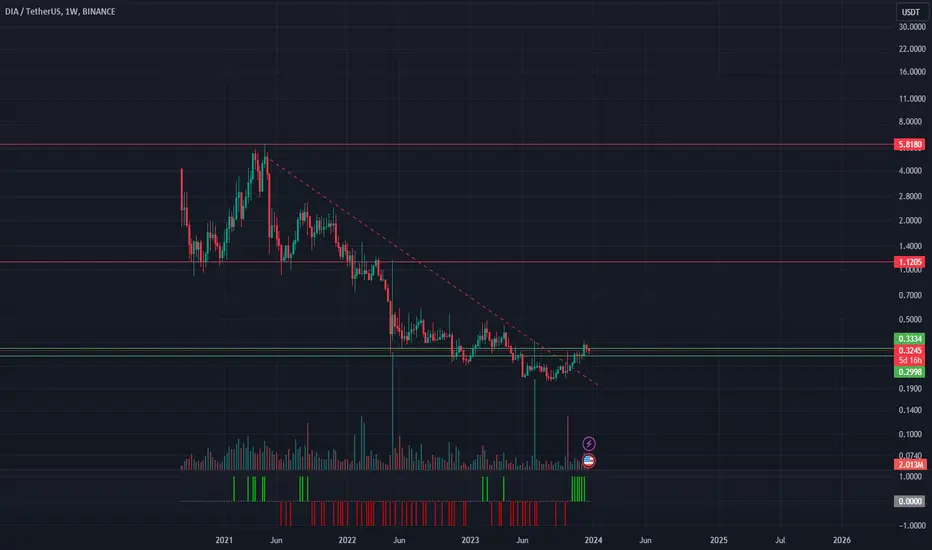
DIA - Is it safe to buy after the pumps ?COINBASE:DIAUSD OKX:DIAUSDT KUCOIN:DIAUSDT
DIA has been in accumulation for long term. Last days, price exited the accumulation phase by breaking the green line in the chart.
Now, DIA is facing a historical resistance level presented by the red rectangle. If closing stays in or above this red rectangle, the 1st objective will be $2.
Be aware that traders who bought the bottom have already made +334%.
- Risk : -75% (going back to bottom)
- Reward : +130%
DIAUSDT trade ideas

DIAUSDT (DIA) Updated till 01-10-24DIAUSDT (DIA) Daily timeframe range. we can see a nice move till today. hold up at 0.7658 at this volume it can easily cross this one if seller dont overcome at this level. recent retrace point at 0.5414 if it can hold the push may continue.

DIA: Above Water (Bullish) vs Below Water (Bearish) | 855% Pot."Above water" is the bullish zone. This is marked here with a blue line on the chart.
"Below water" is the bearish zone. From August 2022 through Jan. 2024, DIAUSDT was trading below water. It moved briefly above water only to move back down later in mid-2024.
After several weeks of bullish action, today, DIAUSDT is back above water and with growing momentum... The doors are open for additional growth.
This is a strong development because this level was pierced once already in early 2024. This second time, staying above can open the doors for long-term growth.
We are looking at 855% potential on this chart and this is mid-term. We can see a new All-Time High in 2025 but it will take some time. We will revisit this chart after some growth takes place.
If DIAUSDT goes back below water, we can expect a bounce after just a few weeks or 1-2 months. The market is set to grow regardless of any potential downside in the short run.
Retraces and corrections can be used as an opportunity to buy-in, rebuy and reload.
Thanks a lot for your support.
Namaste.

DIA USDT Idea BullishBINANCE:DIAUSDT
6day timeframe chart
falling wedge can lead us to quickly 0.81 and new higher high can go to 1.16
NOT A FINANCIAL ADVISE DYOR.

Dia is waiting for 210%#1 First target is 10% in trendline hourly
"In case of a breakout, we are going to 2nd target"
#2 Second target is 40% in trendline daily
"In case of a breakout, we are going to 3rd target"
#3 third target is 210% in trendline weekly
In your responsibility.

Dia is going crazy!! in case of breakout you can predict at least 45% profit and waiting for 200% profit in Bullrun.
In your own responsibility.


DIAUSDT.4HAnalyzing the DIA/USDT chart, I observe a few key technical elements. The price is currently trading in a narrow range, which is encapsulated within the Ichimoku Cloud. This often indicates indecision in the market as traders wait for a clearer signal on the direction of the trend.
The Ichimoku Cloud is flat, which reinforces the indecisive sentiment, indicating a lack of strong trend. The Conversion Line (blue) is above the Base Line (red), which typically suggests bullish sentiment; however, the price being within the cloud doesn't give a clear bullish signal just yet.
The RSI is at a neutral 51, which doesn't suggest overbought or oversold conditions and aligns with the market's current consolidation phase.
The MACD indicates a recent bearish crossover, with the MACD line crossing below the signal line. While this could suggest some bearish momentum, the closeness of the lines and the small histogram values indicate that the bearish momentum is not strong.
The chart indicates resistance at R1 (0.7480 USDT) and R2 (0.8196 USDT), while support levels are marked at S1 (0.6469 USDT) and a further significant level at SZ (0.5346 USDT). These levels will be important to watch for potential breakouts or breakdowns.
From a trading perspective, I would remain on the sidelines until a clearer signal emerges. A breakout above the Ichimoku Cloud and the resistance at R1 might suggest a potential long position with targets at R2. Conversely, a breakdown below the cloud and S1 could signal a short position with the target at SZ. Given the MACD's recent bearish crossover, I would be cautious of a potential downward move, but without a significant momentum indicator, I would wait for additional confirmation before entering a trade.

DIAUSDT.4H
For the DIA/USDT chart you've provided, here's what stands out in the analysis:
Timeframe: The chart is set to a 4-hour timeframe, which gives insights into medium-term trends and potential inflection points.
Ichimoku Cloud: Since the price appears to be trading within the Ichimoku Cloud, this usually suggests a lack of a strong trend and a potential consolidation phase.
Support and Resistance Levels:
R1 (Resistance 1) is around 0.6880 USDT, which might act as a ceiling for price action.
S1 (Support 1) marked at 0.6471 and lower, potentially offering floors where price bounces could occur.
MACD (Moving Average Convergence Divergence): The MACD line is below the signal line and hovering around the zero line, indicating a neutral to slightly bearish momentum. The histogram being close to zero confirms this neutrality.
RSI (Relative Strength Index): The RSI is at 56.12, which is relatively neutral. It indicates neither overbought nor oversold conditions.
Price Action: The price has experienced volatility with several spikes up and down. It appears to be moving sideways currently, within a range marked by the support and resistance levels.
Overall Interpretation: The DIA/USDT pair is showing signs of consolidation with no clear directional trend in the medium term as indicated by the Ichimoku Cloud and MACD. It’s trading between established support and resistance levels, which could be used for range-bound strategies unless a breakout occurs. The lack of a strong trend suggests traders might wait for clearer signals such as a breakout above R1 or a drop below S2 for directional trades. Remember, it’s important to consider updates in the market that might affect the sentiment and to apply proper risk management strategies in trading.

DIAUSDT.4HOn the 4-hour chart for DIA/USDT, the technical analysis suggests that the price action is currently within a bullish phase but experiencing a pullback.
Uptrend Line: A rising support trendline is visible, indicating an established uptrend. The price has recently pulled back to this line, which could provide a springboard for further upward movement if the trend remains intact.
Resistance Levels (R1, R2): The resistance levels are marked at 0.7557 USDT (R1) and higher (R2), which is not fully shown on the chart. These are the prices where the asset previously faced selling pressure.
Support Level (S1): The immediate support level is at 0.6191 USDT (S1). This level may act as a floor in the short term, where buyers might come in to uphold the price.
MACD (Moving Average Convergence Divergence): The MACD is slightly above the signal line, indicating that the bullish momentum might still be in play, although it appears to be weakening as the histogram is quite flat.
RSI (Relative Strength Index): The RSI is around 62, which is neither in the overbought nor in the oversold territory. This indicates that there may still be room for price movement in either direction without immediate pressure from these extremes.
Conclusion:
As a trader, I would view the approach to the rising support trendline as a potential buying opportunity, with the understanding that the trend might continue. However, I would also set a stop loss below the support level to protect my position against a potential breakdown of the trend. If the price bounces off the support trendline and moves upward, I would look to the resistance levels as targets for taking profits. On the other hand, a break below the trendline could indicate a shift in trend, and I would reassess my strategy accordingly, potentially looking for shorting opportunities. As always, it's important to stay updated with the latest market developments and news that could affect the sentiment and price action.

DIAUSDTDIA has formed Cup and Handle Pattern. Currently, after the breakout it tested well the neckline. also, I see the curviness in the price action, mostly likely it will hit the supply with bullish engulfing candle anytime.
Thank you for reading.

Dia is a diamond?High volume at the bottom.
Targetting Fibo 2.618 level.
* What i share here is not an investment advice. Please do your own research before investing in any digital asset.
* Never take my personal opinions as investment advice, you may lose all your money.

DIA.X's MACD Histogram crosses above signal lineThe Moving Average Convergence Divergence (MACD) for DIA.X turned positive on February 02, 2024. Looking at past instances where DIA.X's MACD turned positive, the stock continued to rise in 33 of 41 cases over the following month. The odds of a continued upward trend are 80%.
Technical Analysis (Indicators)
Bullish Trend Analysis
The Stochastic Oscillator suggests the stock price trend may be in a reversal from a downward trend to an upward trend. 51 of 67 cases where DIA.X's Stochastic Oscillator exited the oversold zone resulted in an increase in price. Tickeron's analysis proposes that the odds of a continued upward trend are 76%.
The Momentum Indicator moved above the 0 level on February 01, 2024. You may want to consider a long position or call options on DIA.X as a result. In 84 of 110 past instances where the momentum indicator moved above 0, the stock continued to climb. The odds of a continued upward trend are 76%.
DIA.X moved above its 50-day moving average on February 01, 2024 date and that indicates a change from a downward trend to an upward trend.
Following a +11.71% 3-day Advance, the price is estimated to grow further. Considering data from situations where DIA.X advanced for three days, in 235 of 307 cases, the price rose further within the following month. The odds of a continued upward trend are 77%.
Market Cap
The average market capitalization across the group is 47.23M. The market cap for tickers in the group ranges from 47.23M to 47.23M. DIA.X holds the highest valuation in this group at 47.23M. The lowest valued company is DIA.X at 47.23M.
High and low price notable news
The average weekly price growth across all stocks in the group was 5%. For the same group, the average monthly price growth was 6%, and the average quarterly price growth was 77%. DIA.X experienced the highest price growth at 5%, while DIA.X experienced the biggest fall at 5%.
Volume
The average weekly volume growth across all stocks in the group was 118%. For the same stocks of the group, the average monthly volume growth was 63% and the average quarterly volume growth was 219%

Is DIA preparing for another 102% pump after a breakout?DIA recently made a giant pump and everyone seems to be focused on the data oracle asset right now.
After a brief cool-off, seems we might be gearing up for at least, another 102% pump at the minimum.
What do you think of this?

DIAUSDT - BULLISH OUTLOOKDIAUSDT is currently displaying a strong bullish trend based on price action analysis. This trend is characterized by a consistent pattern of higher highs and higher lows, which is indicative of a robust uptrend. Additionally, the absence of any RSI (Relative Strength Index) bearish divergence is a positive sign, suggesting that the bullish momentum may continue.
With this analysis, a potential trading opportunity arises. You can consider entering a long position at $0.2850 while setting a stop loss (SL) at $0.2450. For take-profit (TP) levels, there are three options based on different risk-reward ratios:
TP 1:1 = $0.3250.
TP 1:2 = $0.3650.
TP 1:3 = $0.4050.
This trade plan is designed to capitalize on the existing bullish trend while effectively managing risk with the stop loss. It's important to remember that all trading involves inherent risks, and market conditions can change rapidly, so stay informed and adjust your strategy as necessary.

DIAUSDT(DIA) Daily tf Range Updated till 20-12-23DIAUSDT(DIA) Daily timeframe range. after some nice pumps it looks a wickout on daily. gotta careful on that. on other hand clearing 0.5349 clean could have led it till 0.7535 if it can stable stay above.

Decentralised Information Asset (DIA)On the above 4-day chart price action has corrected over 90% since the sell signal (not shown). Now is a good long moment. Why?
1) You know why.
2) Price action and RSI resistance breakouts.
3) Regular bullish divergence. Lots of it. 11 oscillators confirmed over 80 days. Awesome.
Is it possible for price action to fall further? Sure.
Is it probable? No.
Ww
Type: trade
Risk: 6%
Duration: no idea
Return: 10x

DIA Coin PRICE PREDICTIONDIA Coin PRICE PREDICTION
🔥 Price on the 4H chart might come at these support area and we might get a potential bounce🔥
Potential bounce areas for Buying 0.4820 and 0.3600
👉 Follow me for more real time opportunities.
Share your Thoughts if you have any?

5000 to 60000hi
Continuing the challenge from $5,000 to $60,000, I decided to choose a currency with a small market cap but with the potential for high growth. Technically, it has broken the trend line and we can enter the pullback, the green lines of the buy points.
and red lines of sales points
DIA [Oracle] Mid + Long Term -> TargetsDIA is just another oracle like TRB or LINK. With a different potential in this space.
TRB had a very nice pump recently ,so DIA has a chance to play catch up.
Fib Targets On-Chart !
In the last couple of hours DIA Price managed to test (kiss) a very important resistance level.
This move is very bullish.
From a pattern POV we may see a cup and handle forming.

DIA/USDT Consolidation BreakTitle: DIA/USDT Consolidation Break
Bias: Bullish
Description: DIA shows strength, trading above SMA lines. An ascending triangle pattern suggests accumulation.
Direction: Anticipate a breakout.
Entry: Above $0.2943 (24 SMA).
Stop Loss: Below $0.2743 (pattern base).
Targets: $0.3130 (resistance), $0.3200 (extended).
Caution: A drop below the triangle pattern would be bearish, invalidating the setup. Watch RSI for momentum shifts.

DIA buying zonei see the red zone as a nice zone for buying DIA .
Notice : as we are right now , 21-17k BTC range , every one can begin to accumulate their desirable tokens , for example 30% now and the rest when prices reached the area mentioned , because the market is a guessing game , no one know exactly what would happen . its okay to start DCA now , because we are already +80% down from almost all ALTS ATH . I want to point out , that the price could go even lower than the zone mentioned , however , as i mentioned before , from here every one can start DCA , no one could catch the real bottom unless he has a time travel machine .
not a financial advice , only for entertainment .
thank you

Just received buy signal on DIAHoping for some fireworks. stop loss just below the buy candle
First target 0.28
contact me for indicator
