Possibility of uptrend Wave c is expected to end at the green support zone and start an uptrend. A break of the support zone will invalidate the above scenario.
DJI trade ideas


US30US30 Daily time frame analysis
Inverted Head/shoulder pattern formed also facing downtrend resistance
Take entry after break of neckline
Targets mention

US30 - LONGIntraday trade. Had a nice spike to the upside after tariffs news. London session reversed and now looking for price to push back up and wipe away the London session sell off.

US30 Footprint Update | May 29, 2025We're witnessing a clear shift in order flow dynamics on the 1H footprint chart.
🔻 Earlier in the session, sellers were firmly in control with heavy negative delta and large sell imbalances between 42,280–42,120.
🔄 Key Change: Around 42,088–42,177, aggressive selling was absorbed, followed by a strong bullish delta of +125 and increasing buyer interest in the following candles. Volume has flipped in favor of buyers.
📈 Current Price: Holding around 42,191.50, just below the key resistance zone of 42,231. A clean break and acceptance above this level could confirm a bullish shift toward 42,280–42,300.
🧠 What I’m Watching:
Break and hold above 42,231 = long continuation
Failure to sustain = possible retest of 42,177 or lower support
🎯 Volume and delta are aligning in favor of bulls — let’s see if they can take control.

BUY US30 NOWThe market has been forming HH and HLs. Just follow the trend. Yes, there appear to be a support break which is going to make people sell - that break is a fake out. The market is bullish.

DowJones INTRADAY important resistance retest Key Support and Resistance Levels
Resistance Level 1: 42,920
Resistance Level 2: 43,300
Resistance Level 3: 43,620
Support Level 1: 41,470
Support Level 2: 41,160
Support Level 3: 40,890
This communication is for informational purposes only and should not be viewed as any form of recommendation as to a particular course of action or as investment advice. It is not intended as an offer or solicitation for the purchase or sale of any financial instrument or as an official confirmation of any transaction. Opinions, estimates and assumptions expressed herein are made as of the date of this communication and are subject to change without notice. This communication has been prepared based upon information, including market prices, data and other information, believed to be reliable; however, Trade Nation does not warrant its completeness or accuracy. All market prices and market data contained in or attached to this communication are indicative and subject to change without notice.

us30 buyThis is a good opportunity to buy. With capital management, you can enter a buy position in the specified area and target the daily ceiling.

Let the Market show its hand Looking for longs in the blue box area
If no bounce a long of the lower orange point of control.
Beware the market could be in a short down trend if lower untested POC is met so i will reduce my risk and when possible protect my profits .
I will short the position if the market turns on my longs from the blue box area

Hanzo / US30 15 Min Path ( Confirmed Bullish Reversal )🆚 US30
The Path of Precision – Hanzo’s Market tactics
🔥 Key Levels & Breakout Strategy – 30 M TF
☄️ Bullish Reversal – 42400 Zone
Price must break liquidity with high volume to confirm the move.
Reasons
Bullish After Retest
42450
1hr key level
Retest - History Of 42470
21 May / 2025
19 May / 2025
16 May / 2025
12 May / 2025

Dow Eyes 42,800 Resistance – Key Breakout Ahead?The Dow is currently holding near the neckline of a double-top formation that developed between December 2024 and February 2025, possibly buoyed by ongoing tech and Nasdaq optimism. The broader rebound from the 2025 lows is also forming a diagonal structure, setting up the following scenarios:
Bullish Scenario:
With weekly RSI holding above the 50 neutral zone after rebounding from oversold levels last seen in 2020, a sustained move above the 42,800-resistance level could extend the rally toward 43,800 and 44,800. A breakout above the all-time high near 45,000 would open the door toward the next major resistance at 46,800.
Bearish Scenario:
If the diagonal formation breaks to the downside—below 41,400 and 41,000—selling pressure could resume, forming a diagonal correction targeting support levels at 40,400, 39,700, and 39,000.
Written by Razan Hilal, CMT

US30Correlation Between US30, 10-Year Bond Yields, Bond Prices, and DXY
1. Bond Prices vs. Yields
Inverse Relationship: Bond prices and yields move inversely. When bond prices rise, yields fall, and vice versa.
Example: If the 10-year Treasury bond price drops (due to selling pressure), its yield rises to attract buyers.
Current 10-year yield: 4.54% (as of May 21, 2025).
2. 10-Year Yield vs. DXY (US Dollar Index)
Typical Positive Correlation: Higher yields attract foreign capital into USD-denominated assets, strengthening the dollar (DXY↑).
Recent Divergence:
A rising 10-year yield paired with a weakening DXY may signal market skepticism about Fed policy or risk aversion (e.g., investors favor Treasuries as safe havens despite lower yields).
Example: If yields rise due to inflation fears without economic growth, DXY may weaken as traders doubt the Fed’s ability to sustain rate hikes.
3. DXY vs. US30 (Dow Jones Industrial Average)
Inverse Correlation: A weaker dollar (DXY↓) often supports equity indices like US30, as multinational companies benefit from cheaper exports and higher overseas earnings.
Exceptions:
In risk-off environments, a stronger dollar (DXY↑) may coincide with equity sell-offs as investors flee to safe-haven assets.
4. 10-Year Yield vs. US30
Mixed Relationship:
Negative: Rising yields can pressure equities (US30↓) as higher borrowing costs reduce corporate profits and make bonds more attractive.
Positive: Yields rising due to growth optimism may lift stocks (US30↑) if earnings expectations improve.
5. Yield Curve Dynamics (30-10 Year Spread)
Current Spread: 0.51% (30-year yield: 4.94%, 10-year yield: 4.43%).
Implications:
A widening spread (30-year > 10-year) suggests long-term growth/inflation expectations.
A flattening/inverted spread signals economic uncertainty or recession fears.
Summary Table of Relationships
Factor Relationship with DXY Relationship with US30
10-Year Yield ↑ Typically ↑ (if growth-driven) ↓ (if rate-driven) / ↑ (if growth-driven)
Bond Prices ↑ ↓ (yields fall, USD less attractive) ↑ (cheaper borrowing)
DXY ↑ — Typically ↓ (hurts exports)
30-10 Spread Widens Neutral ↑ (growth optimism)
Key Scenarios
Risk-On Environment:
DXY↓ + US30↑ + Yields↑ (growth optimism).
Example: Weaker dollar boosts equities despite rising yields.
Risk-Off Environment:
DXY↑ + US30↓ + Yields↓ (safe-haven demand for bonds and USD).
Policy Divergence:
Yields↑ + DXY↓ (markets doubt Fed’s ability to sustain hikes despite inflation).
Conclusion
The interplay between US30, bond yields, prices, and DXY is dynamic and context-dependent:
Yield-DXY Link: Normally positive but can diverge during policy uncertainty or risk aversion.
DXY-US30 Link: Typically inverse but influenced by macroeconomic drivers.
Yield Curve: A widening 30-10 spread supports growth optimism, while flattening signals caution.
Traders must monitor Fed policy, inflation data, and risk sentiment to navigate these correlations effectively.

Dow Jones Continues Its Upward Momentum Toward the 43,344 Level The Dow Jones Industrial Average is showing continued bullish momentum, with an anticipated move toward the 43,344 level following a retracement to the support zone around 42,290–42,250. A price close above last week’s closing level reinforces the bullish sentiment, providing further upward momentum for the index toward the targeted levels outlined in the accompanying chart.
#Dow Jones Industrial Average
#US30
#Technical Analysis
#Chart Patterns
#Price Action
#Global Markets
#Market Outlook
#Swing Trading

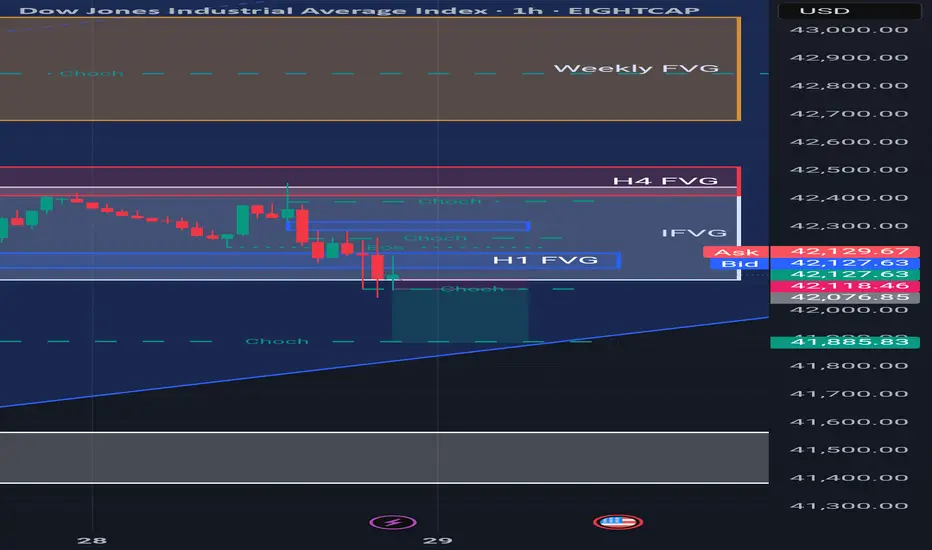
Sell us30 Key Observations:
Market Structure:
Choch (Change of Character) marked → suggests a shift from bullish to bearish structure.
BOS (Break of Structure) below recent lows confirms bearish pressure.
Fair Value Gaps (FVGs):
H1 FVG and IFVG (Internal FVG) have already been touched and price reacted bearishly.
H4 FVG above is unmitigated, acting as a potential supply zone.
Weekly FVG above current price – could be a long-term draw on liquidity but not immediate.
Trendline (Support):
Price is approaching an ascending trendline acting as dynamic support around 41,890 area.
If this trendline holds, a bounce is possible before any further drop.
Price Action:
Strong bearish candles breaking through the H1 FVG.
Sell-side liquidity beneath equal lows and trendline may be the target.
---
🧠 Bias Summary:
✅ Short-Term Bias: Bearish
Reason: BOS + Choch + strong downside momentum + fair value gap fills.
Expectation: Price may seek liquidity below the trendline (41,800–41,600 zone).
⚠️ Watch for a Potential Bounce:
At the trendline zone (41,880–41,900), possible reaction or retracement.
If a strong bullish reaction forms here with displacement, we could see a move back up to fill the H4 FVG.
---
📍 Bias = Bearish, with potential for short-term retracement or liquidity sweep before continuation

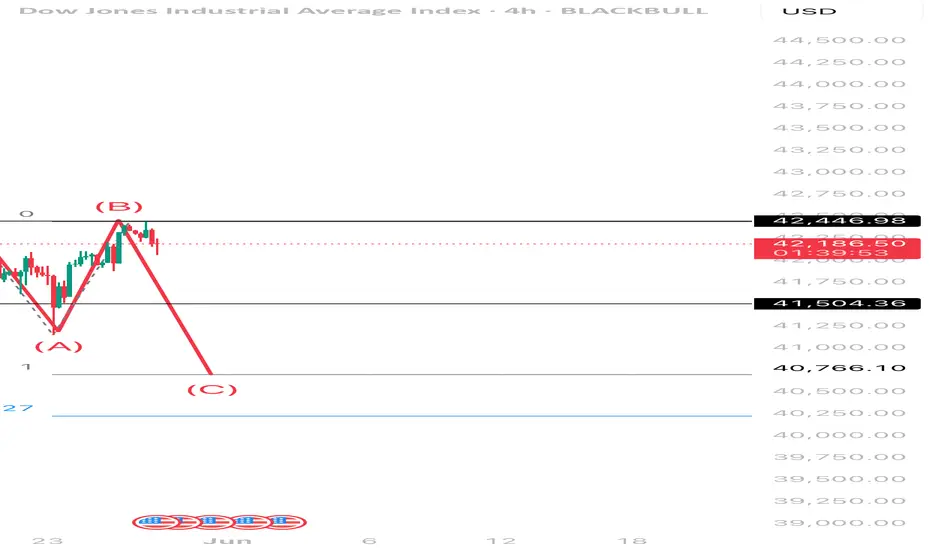
US30 Short - Elliotts Impulse and correction wavesWe see an impulsive move (1-5) and now completing corrective wave (A-C) with targets at Fibonacci extension 1.27

US30 Sell - Elliotts Impulse and Correction We see an impulsive and corrective move, targeting 1.27 Fibonacci level
Dow Jones (US30)The Dow Jones is due to see weakness as the US Dollar finds its footing seeking high prices and attacking 4Hour Resistance structures.
We expect a Bullish US Dollar which supports our Bearish notion on US30.

DOW JONES: Channel Up targeting 43,400.Dow Jones is practically neutral on its 1D technical outlook (RSI = 55.880, MACD = 380.350, ADX = 13.770) as the price is consolidating on its 4H MA50. Despite the neutrality, it remains inside the Channel Up, that is supported by the 4H MA200 and whose 4H RSI squeeze indicates we might be on a similar slow uptrend as late April's. We expect a similar +5.60% rise from the HL bottom, TP = 43,300.
## If you like our free content follow our profile to get more daily ideas. ##
## Comments and likes are greatly appreciated. ##

Price Patterns Every Trader Should KnowLearn how to trade using price patterns! In this video, we cover continuation, reversal, and bi-directional patterns, including flags, wedges, triangles, and more. You'll see schematics, real chart examples, and learn how to combine them with confluence for better setups.
#PriceAction #ChartPatterns #TechnicalAnalysis #TradingStrategy #ForexTrading #CryptoTrading

The Dow Jones Begins to Stabilize Around 42,500 PointsThe U.S. index has halted the advance of its recent bullish moves near this resistance zone, mainly because the market is awaiting the release of the Federal Reserve minutes later today, along with Nvidia’s earnings report, expected after the stock market close. For now, investor anticipation has created a neutral sentiment in the index's recent movements as it approaches the 42,500-point resistance, and these upcoming events are likely to provide deeper insight into the market’s direction in the coming sessions.
Possible Bullish Channel
Since early April, the Dow Jones has shown consistent buying movements, attempting to maintain a potential bullish channel. So far, there have been no signs of significant bearish corrections in the price, which suggests that the current bullish pattern remains the dominant structure to monitor in the short term. However, a strong selling correction could put this trend at risk.
Neutrality Intensifies:
MACD: The MACD histogram continues to hover around the zero line, reflecting a sustained equilibrium in the momentum of the moving averages. This highlights a lack of clear direction in the market over the short term.
ADX: The ADX line remains below the 20 level, indicating that volatility is low, a condition not seen since February of this year.
Both indicators point to persistent neutrality, likely driven by market indecision ahead of key fundamental events, as well as the technical resistance zone, which is currently limiting price advances.
Key Levels to Watch:
42,500 points: Current resistance level aligned with the 200-period moving average. It may act as a potential point for bearish corrections.
43,800 points: A distant resistance level not seen since February. If the price rallies to this level, it could reinforce the current bullish formation and strengthen the prevailing upward channel.
41,100 points: A key support aligned with the 50-period moving average. A drop near this level could jeopardize the bullish formation and potentially shift momentum toward a bearish bias.
Written by Julian Pineda, CFA – Market Analyst

Hanzo / US30 30M Path ( Confirmed Bullish Breakout Zones )🆚 US30
The Path of Precision – Hanzo’s Market tactics
🔥 Key Levels & Breakout Strategy – 15M TF
☄️ Bullish Setup After Break Out – 42240 Zone
Price must break liquidity with high volume to confirm the move.
Reasons
Bullish After Break
42250
🚀 1hr key level
Retest - History
27 May / 2025
21 May / 2025
19 May / 2025
16 May / 2025
15 May / 2025
14 May / 2025

Us30 sell . Higher Timeframe Structure (HTF bias) – Look at Daily, 4H, or 1H timeframes.
2. Market Structure (SMC) – Are we in a clear bullish or bearish structure?
3. Premium/Discount Zones – Relative to the recent range.
4. Liquidity Pools – Equal highs/lows, trendline liquidity.
5. Fair Value Gaps (FVG) – Gaps that price might be targeting or rejecting.
6. News & Macroeconomic Context – Especially for indices.
---
As of Now (May 28, 2025) – Please Confirm if You Want a Live Update
If you'd like a real-time bias, I can pull up the latest chart data. Otherwise, here's how to analyze it manually:
---
How to Find Bias for US30 – Example Framework
🔎 Step 1: Check Daily/4H Structure
Higher highs & higher lows → Bullish bias
Lower highs & lower lows → Bearish bias
🔎 Step 2: Identify Liquidity
Look for equal highs/lows – those are likely targets.
🔎 Step 3: Use FVG Zones
If price is inside a bullish FVG and rejecting, bias could be bullish.
If price is filling in a bearish FVG and breaking down, bias could be bearish.
🔎 Step 4: Premium/Discount
Use a Fib from recent swing high to low.
Above 50% = premium → Look for shorts
Below 50% = discount → Look for longs
