DJI trade ideas


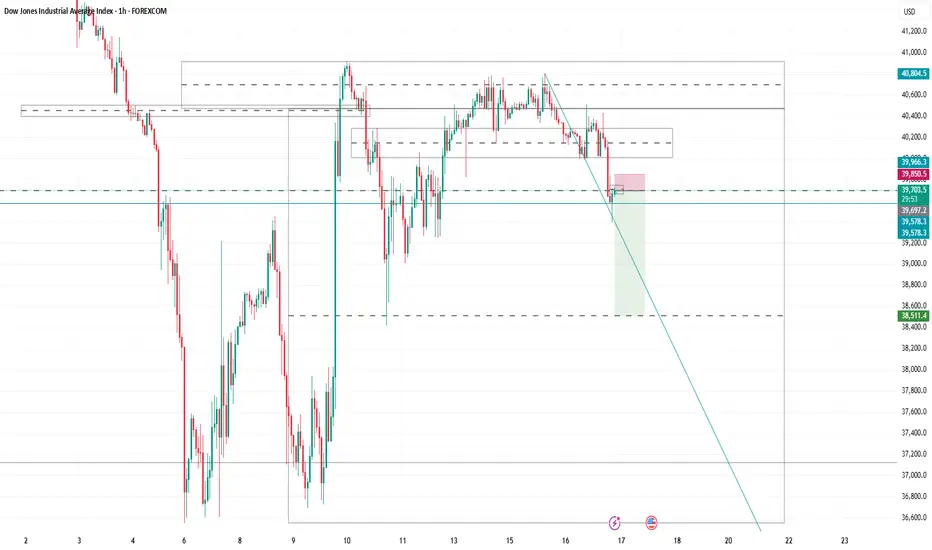
DOW/US30Team, time to go long DOW/US30
yesterday the market disappointed on the FED decision,
i just cant believe the FED compare the inflation in 2020-2021 that is where the COVID and lock down. And compare to 2024. he should have cut the interest rate to ease the market.
Given the fact the market is dropping 1000 points, i expect we should have some recover at least 200-300 points medium
Target 1 at 39225
Target 2 at 39335-39420
Target 3 at 39560-39670
We should see the market pump in 2-3 hour time frame or recover.


Dow INTRADAY key resistance at 41333Key Support and Resistance Levels
Resistance Level 1: 41333
Resistance Level 2: 42000
Resistance Level 3: 42800
Support Level 1: 39220
Support Level 2: 37554
Support Level 3: 36620
This communication is for informational purposes only and should not be viewed as any form of recommendation as to a particular course of action or as investment advice. It is not intended as an offer or solicitation for the purchase or sale of any financial instrument or as an official confirmation of any transaction. Opinions, estimates and assumptions expressed herein are made as of the date of this communication and are subject to change without notice. This communication has been prepared based upon information, including market prices, data and other information, believed to be reliable; however, Trade Nation does not warrant its completeness or accuracy. All market prices and market data contained in or attached to this communication are indicative and subject to change without notice.

DOW JONES / US30There is a possibility of price correction from the range of 38903.71 towards 39915 and it can be entered as a trade.

Dow Jones Wave Analysis – 17 April 2025
- Dow Jones reversed from the resistance zone
- Likely to fall to support level 38500.00
Dow Jones index recently reversed down from the resistance zone between the resistance level 40815,00 (former strong support from the start of March), 20-day moving average and the 61.8% Fibonacci correction of the downward impulse from last month.
The downward reversal from this resistance zone stopped the previous minor correction (iv) from the start of April.
Given the clear daily downtrend, Dow Jones index can be expected to fall to the next support level 38500.00.

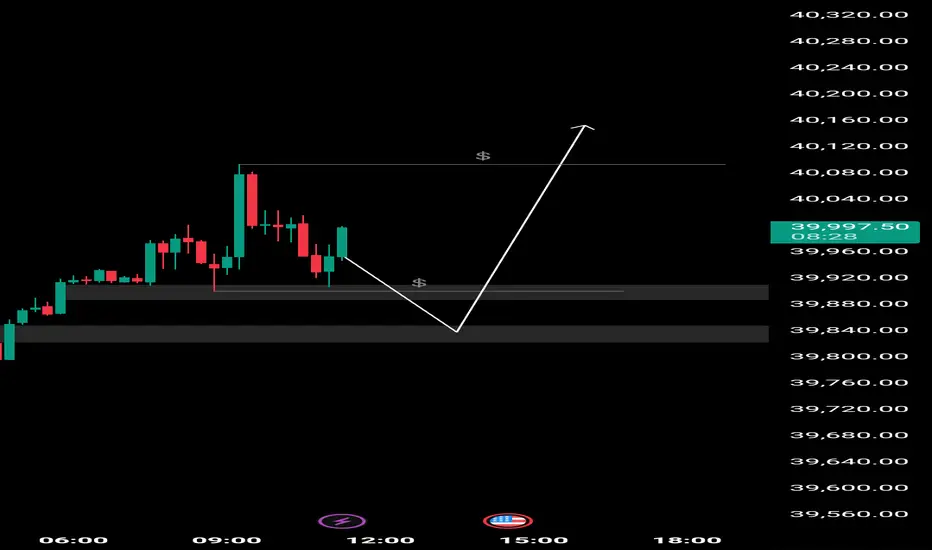
US30We can attempt to buy US30 from specified level as it make HL , also there is no bearish divergence occur indicate that it moves upward.

US30/ Dow jonesConsidering the high that was hit during London session, I’m waiting to see what happens during the New York session. If that high breaks, I’ll look to buy; if not, I’ll be selling.

US30 Long 15 & 5 min
BLACKBULL:US30
We can see 2 relatively equal lows, which to my opinion may get swept to fill the fair value gap below, and then react to the point that we sweep the swing high
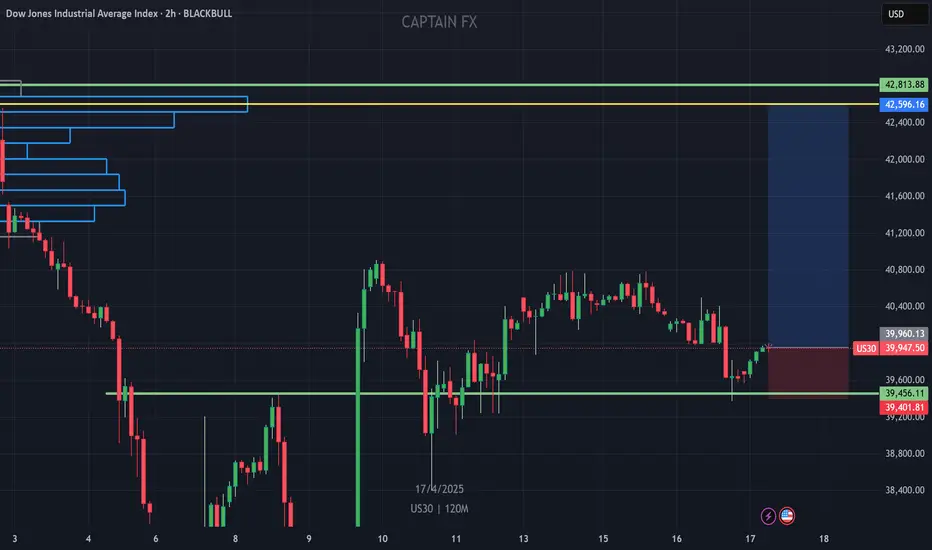
US30 BUY NOW!!!!!!!!US30 created a double bottom on the 2h chart price have already made a retest off the neckline region am in again on buys holding to see price arrive at the POC level
JOIN AND ENJOY........
Dow Jones Update: Downside Pressure PersistsI currently estimate that the Dow Jones is in the early stage of wave B of wave (B), as indicated by the black label. This suggests that the index may continue its correction, potentially testing the 38,200–39,186 area before rebounding to challenge the resistance zone around 40,791 and possibly filling the gap between 41,173 and 41,629.
However, under the more bearish scenario (red label), the selling pressure on the Dow Jones remains significant, which may result in the formation of wave , leading to a deeper correction below the 36,611 level.

Trade Idea: US30 Short ( SELL LIMIT )Technical Overview:
Daily Chart:
• Clear downtrend with price sharply rejecting from recent highs (~42890).
• MACD shows strong bearish momentum with a widening histogram.
• RSI is below 50 at ~45, confirming downside pressure.
• Price has broken below a key support level near 40200, now acting as resistance.
15-Min Chart:
• Recent lower highs and lower lows.
• MACD negative, with RSI nearing oversold (33), suggesting bearish bias but short-term exhaustion.
3-Min Chart:
• Sideways chop after a sharp down move, showing bear flag/consolidation pattern.
• MACD still negative, RSI around 49—no clear bounce signal.
⸻
Fundamental Overview:
• Recent macro uncertainty (possibly due to inflation/Fed comments or geopolitical tensions) likely weighs on risk sentiment.
• Bond yields are likely pressuring equities, and the US30 tends to be rate-sensitive.
⸻
Trade Setup: SHORT
• Entry: 40250 (if price pulls back slightly into minor resistance zone)
• Stop Loss: 40500 (above recent local high on intraday chart)
• Take Profit: 39600 (next strong daily support level)
FUSIONMARKETS:US30

Us30What I have realized is price is ranging in between HOD and LOD using inside multiple rejection zones to confuse me,so for now I want to see if it will buy till the HOd since I spotted a ranging market