Watch Dow Utility Trend LinesA break of the DJU trendlines could determine its course for the next several weeks.
A break above the DJU declining trendline from the December 2022 peak could open the door for a rally to 1,000.
A break below the DJU rising trendline from its October 2023 bottom could trigger a move back down to the October 2023 bottom.
A move below the weekly RSI moving average could be an important confirming sell signal.
DJU trade ideas


Completing A flag!....looks like a Sound Signal to long DJUA! Chat tell us to buy DJUA & is a good signal for shorting Dollar Index!


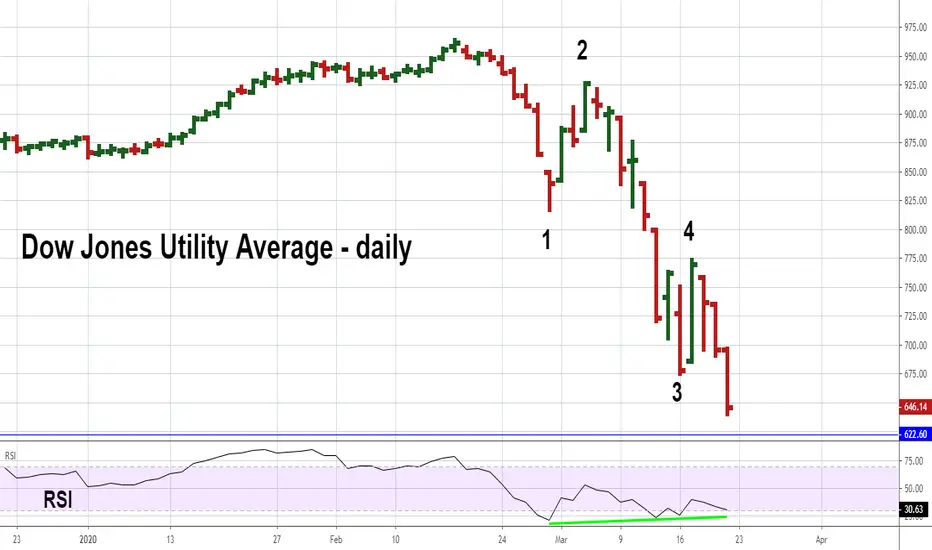
Dow Utilities Could Find Crash Bottom - Part TwoWithin an Elliott five wave impulse pattern, wave "one" is usually equal to wave "five".
On the daily Utility chart wave "1" = 145.83 points.
The wave "4" high is 773.49 - 145.83 = 627.66 as target for wave "5" bottom.
The DJU rally from March 2009 to February 2020 was 675.14 points x .50 = 337.57 points.
All-time high was 963.80 - 337.57 = 626.23 as target for a bottom.
The DJU rally from September 1974 was 905.87 points x .382 = 346.04 points
All-time high 963.80 - 346.04 = 617.76 as a target bottom.
The November 2016 bottom was 616.96.
Target range for DJU crash bottom is 615.00 to 628.00
Mark

Dow Utilities Could Find Crash Bottom - Part OneThe Dow Jones Utility Average could be the most important US stock index to watch during the week of March 23 to March 27.
This index has the clearest Elliott wave count, showing its probably in the fifth wave down from the all-time high.
There's fascinating short and long term Fibonacci relationships which will be explained in part two of this very important post.
Mark

Industrials consumption of the staples defensives sector...Industrials consumption of the staples defensives sector... proportion not yet the same as the two previous cycles dot com and subprime bubbles....

DJU Utilities Short OpportuintyDow utilities index ended the week at 711.
If it breaks above 713 - 38.2 Fib Retracement-, it is likely to test Fib 61.8.
We plan to short DJU at Fib 61.8 - 732.02 -
Note: Bearish Swan at 729-732


Utility average bottoming?40 month moving average is one of my basic markers for fair value. Will it hold the channel?

DJUA Nearing Buying Opportunity - part twoThe DJUA Elliott wave count of the recent decline is exceptionally clear.
If the count is correct,there could be one more rally for a few days followed by a final decline
to new lows and .618 Fibonacci support.
Note - Alternate count has wave "C" of an "A-B-C" Zigzag complete at either the 1/12/18 low
or to bottomed in the support zone on 1/16/18 - New moon day. ** US Stock market closed on 1/15/18.
After bottom is in place, subsequent rally could last for several weeks.
Mark

DJUA Nearing Buying Opportunity-Part OneThe DJUA is nearing .618 support at the same time the Daily RSI is deeply oversold.
Elliott wave analysis indicates downward trend could continue for another five to eight trading days.
***Wave count will be illustrated in my next post.
If the DJUA bottoms soon the next rally could last for several weeks.
Mark

Dow Jones Utilities Nearing Major TopThe Dow Jones Utility Average (DOWU) appears t be very close to completing an Elliott wave - Ending Diagonal Triangle (EDT).
The 2017 high is 755.37 the high today is 755.00 with the FOMC announcement on 11/1/17 watch for the DOWU to possibly move
above 755.37. Also rising EDT's usually complete with a slight throw over beyond the upper trend line.
Mark

Utilities 8/26/2016Will Utilities volatility spike coincide with stock market volatility spike this time? I think it's worth a bet.

Rise for utilities DOWU Hello, ladies and gentlemen! From my perspectve, there is a perfect time for going up of utilities (AWK, NEE, NI, SO and so on). But I am afraid that the possible pull back of SP500 might influence the trends. What do you think guys?

DOW Utilities 7/29/2016It seems if there is no crash in Utilities, then there is no crash in the stock market, we need to watch the lines here. Utilities are very high right now.

Utilities 7/8/2016It seems only volatility in Utilities can truly threaten equity , so that this might be the ultimate indicator for going short equity . Right now the danger level is very low, because Utilities are through the roof.


Has DOW Utilities finished its down trend since January? DOWU has been in a down trend since January of this year. The top in January was 657 and on March we found a bottom at 565.55. The drop of 14% was result of a 25.65% up trend that started in July of 2014 up by 174 days.
With bond yields going up there could be room for a drop to 560. RSI is showing that the index is taking a breath from this 42 days drop since the begging of this cycle.
If the index surpasses 600.35 resistance there is room to go up to the 607 and 609 resistances.
If the index breaks the support at 565.55 there is room to go down to the 560 and 552.67 supports

Don't overlook thisSince DJIA has only 30 components, and not sufficient to portray the general pictures, as a result DJ Transportation and DJ Utilities are created as well. 1st it was the Industrial index making all time high, followed by the transportation index, and now the utilities index.
I can see that 2 massive rejection by 580, plus the bearish divergence comparing to the previous top in July.
P.S. Just take note if you are already shorting.. tonight might be another super bullish trading day to wash out the bears, but next Monday we might see sentiment changed with a blink of an eye.

DowU_nder neckline? Possible SHS & ABCD targets....if!Dow Utilities could setup a classic SHS pattern (in orange and target in yellow) with a neckline around the 527 handle.
Left and right shoulder are now at the same highs with a 61.8 retracement of the head - at the 577 handle.
The other pattern is a harmonic ABCD patern (in blue) with a target at the 510 handle
Momentum on the MACD histogram is decreasing
Will it play out....time will tell...as always
Safe trading L&G
@BLawrenceM
Music at work:
www.youtube.com
open.spotify.com
