DODOUSDT | Buy Now, Thank Later | Near Term (4HR)DODOUSDT | Buy Now, Thank Later | Near Term (4HR)
Money flow... BTC, then ETH, then Large Caps, Then Mids and Smalls
Additional altcoin near term and midterm chart ideas listed below
Timeline of events for the Bull Market indicated on chart
LPTUSDT | Buy Now, Thank Later | Near Term (4HR)
VRAUSDT | Buy Now, Thank Later | Near Term (4HR)
XCHUSDT | Buy Now, Thank Later | Near Term (4HR)
CSPRUSDT | Buy Now, Thank Later | Near Term (4HR)
VELOUSDT | Buy Now, Thank Later | Near Term (4HR)
UMAUSDT | Buy Now, Thank Later | Near Term (4HR)
OGNUSDT | Buy Now, Thank Later | Near Term (4HR)
DOTUSDT | Buy Now, Thank Later | Near Term (4HR)
VIDTUSDT | Buy Now, Thank Later | Near Term (4HR)
BTCUSDT | Alts Poised to Explode | Near Term (2H)
Mock Up Price Action for ALGOUSDT | Mid Term (12HR)
MYRIAUSDT | Interested to see where this goes | Mid Term (2D)
Mock Up Price Action for VRA w/ Timeline | Mid Term (3D)
Mock Up Price Action for XCH | Mid Term (12HR)
OGNUSDT | Interested to see where this goes | Mid Term (3D)
Mock Up Price Action for CSPRUSDT | Near/Mid Term (2D)
VIDTUSDT | Interested to see where this goes | Mid Term (3D)
RAREUSDT | Interested to see where this goes | Mid Term (3D)
DODOUSDT trade ideas

DODO USDT Spot trade 50% potential DODO/USDT is showing signs of a potential breakout, with a possible 50% upside in the near term. The price is approaching key resistance levels, and if it breaks above with strong volume, we could see a rally. Watch for confirmation through technical indicators such as moving averages and RSI to manage risk effectively. 📈 #DODO #Crypto #Breakout

DODO buy/long setup (1D)A bearish tigger line has been broken and we have a bullish CH and BOS on the chart.
We have a support swap zone on the chart which is our buy/long position.
Closing a daily candle below the invalidation level will violate this analysis
For risk management, please don't forget stop loss and capital management
When we reach the first target, save some profit and then change the stop to entry
Comment if you have any questions
Thank You

Forex Signal Alert: DODOUSDT Pair MovementCurrent analysis suggests a Sell position for the DODOUSDT pair.
Enter Price: 0.1433
Take Profit: 0.13866667
Stop Loss: 0.15106667
Our forecast indicates a downward trend supported by EASY Quantum Ai strategy insights. Historical data analysis points to an overbought condition in the market, depicted by oscillating indicators reaching high threshold levels. Recent market dynamics show a declining buying pressure, suggesting potential bearish momentum continuation.
Further analysis of macroeconomic factors such as DODO market capitalization and USDT liquidity shows an increase in DODO supply without equivalent demand rise, likely pushing prices lower. We also observed a weakening support level at the 0.1450 mark, reinforcing the possibility of downward movement.
Traders should be mindful of the risk with the set Stop Loss , considering the possibility of market volatility and sudden reversals.
Technical indicators, including moving average convergence, support the likelihood of a price decline, creating a favorable condition for the Sell strategy.
Stay alert and manage your trades wisely!

DODO cup and handle break outIt should go well, cup and handle is bullish pattern. GL
NOT A FINANCIAL ADVICE
ALWAYS MANAGE YOUR RISK AND USE STOPLOSS

Dont sleep on DODOVery bulish pattern, red MA cam act like a magnet for price now which can be 40% profit at least.
PA and TA is bullish to me.
NOT A FINANCIAL ADIVCE
ALWAYS USE STOPLOSS AND MANAGE YOUR RISK

DODOUSDT Trade Idea. I like the Odds of this !💲💲💲💲💲
The candles on this ticker is always crazy !
OBV Moves signalling big positions, RSI is in an OKAY place.
#DODOArmy, here we go. 🚀
1:7 Risk to Reward, Reduce at TP's, manage your risk and exposure.
As always, Stay Safe and DYOR.
#TheHopinionist

DODOUSDT LONG IDEAThe player leads a large accumulation of this asset.
Now the price is at a strong support zone, which gives us a good long entry point with great potential.
All targets are indicated on the chart.

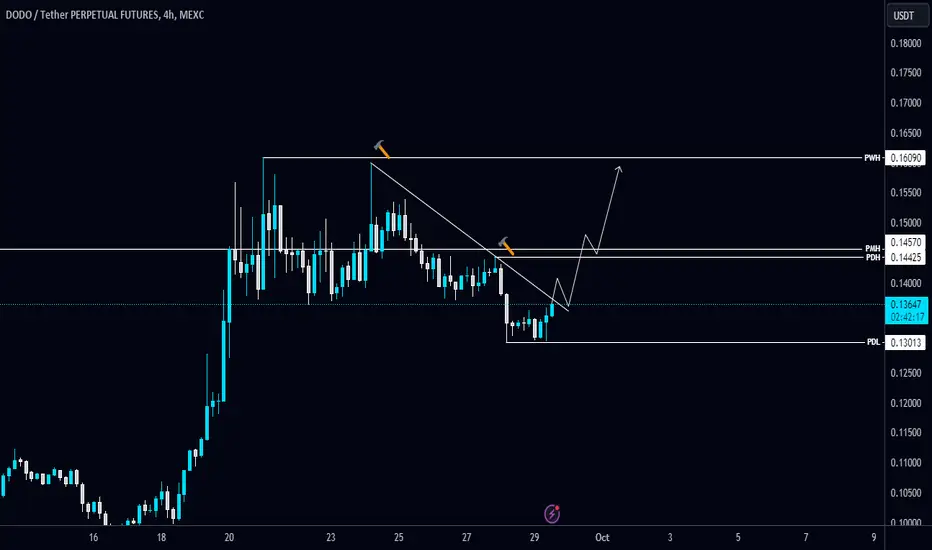
#DODO/USDT is heading towards the Diagonal Trendline in 4-Hour T#DODO/USDT is heading towards the Diagonal Trendline in 4-Hour TF!
Wait for BO/retest to long it. GETTEX:DOD local resistance level is PMH $0.1457. The strong support level is PDL $0.13013.
DODO DODO seems fertile due to the channels and the existing pattern, however, it might take longer than this speculation.

DODOUSDT Triple Bottom BreakoutDODOUSDT Technical analysis update
The DODO price has broken the triple bottom neckline resistance line with high volume and is trading above the 100 and 200 EMA on the daily chart. We can expect a strong bullish move.
Resistance 1: $0.225
Resistance 2: $0.325
Regards
Hexa

DODO | Activity, Price Action, MACD & RSI (Basics + 1800% Pot.) This is a signal that we are seeing very often now; After a strong down wave, we have a flat bottom, which simply means a support level being established. Trading volume starts to rise on the bulls side and we experience short-term lower highs.
This is the transition from a bearish wave to a bullish wave. This is what we are seeing in this DODOUSDT chart.
We can expect growth to happen next based on these signals.
We are focusing on these but there is always more, so much more.
Let me give you some examples.
➖ If you open the daily RSI for DODOUSDT, you would see a very strong bullish reading. When the RSI is strong while a pair is trading near support, at low prices, this signals that the trend is about to change.
➖ If you open the MACD on the daily timeframe for DODOUSDT, you can see it either trending up strong or already within the bullish zone. These signal combined with the flat bottom and rising volume can build a strong case to support a bullish bias.
Thank you for reading.
Namaste.

DODO Secondary trend. 02 09 2024Logarithm. Time frame 3 days (less is not needed). The price is in a horizontal channel, at the support zone, near the capitulation zone and liquid zones, which can give a massive triggering of long stop loss under the channel.
A descending wedge (secondary trend) was formed by the decline from 03/13/2024. Its breakthrough is a trend break.
The chart shows two average, not maximum targets for breaking the descending wedge (secondary trend) for orientation:
🟢 1) maintaining channel support and not entering the capitulation zone.
🔴 2) entering the capitulation zone.
______________________
The previous idea (wedge and work in the accumulation channel) for this coin and a similar trading situation that was published more than a year ago before the reversal (about +200%)
DODO/USDT Secondary trend. Accumulation channel 08 2023
_____________________
The prices are currently acceptable from the standpoint of both the secondary trend and the main one.
⚠️ Due to the rather low liquidity, capitulation zones are extensive on such cryptocurrencies due to price slippage. Remember this and work wisely with the margin, and it is better to work with such cryptocurrencies only on the spot.
🟢 In the long term, this DEX will be heavily pumped up. Now they are pouring in a lot of money. The network has grown by 200% in users in a few months. This is all happening unnoticed against the background of the negative local fall of bitcoin.
Linear price chart.
Main trend. Time frame 1 week.
DODO Main trend 09 2024

DODOUSDTWe can attempt to buy DODOUSDT from specified level as it make HL , also there is no bearish divergence occur indicate that it moves upward.
SL , TP mention in chart.

DODO Main Trend 09 2024Logarithm. Price at support of horizontal long-term accumulation channel, near capitulation zone. Medium-term and long-term targets of this cycle.
📊DODO network growth over the last couple of months by more than 200%. Pay attention to this DEX.
This horizontal channel on a larger scale.
Secondary Trend Wedge and Capitulation Zone.

DODO/USDT Technical Analysis in a 3-Day TimeframeHello everyone, I’m Cryptorphic.
For the past seven years, I’ve been sharing insightful charts and analysis.
Follow me for:
~ Unbiased analyses on trending altcoins.
~ Identifying altcoins with 10x-50x potential.
~ Futures trade setups.
~ Daily updates on Bitcoin and Ethereum.
~ High time frame (HTF) market bottom and top calls.
~ Short-term market movements.
~ Charts supported by critical fundamentals.
Now, let’s dive into this chart analysis:
DODO has been in a downtrend since March 2024 and is now close to the support line at $0.0915. The price is likely to reach the lower support level, ranging between $0.0713 and $0.0915.
A rebound is likely once the price hits this support range. The RSI is forming a bullish divergence pattern, indicating a possible reversal soon.
Key levels:
- Support level/Accumulation: $0.0713 to $0.0915.
- Target: 2x-3x.
- RSI: Bullish divergence formation.
DYOR, NFA
Please hit the like button to support my content and share your thoughts in the comment section. Feel free to request any chart analysis you’d like to see!
Thank you!
#PEACE

DODOUSDT Rectangle PatternDODOUSDT Technical analysis update
DODO's price has been trading within a rectangle pattern for the last 840 days and price has now dropped again to the box's support level. we can expect a bullish move from the current rectangle support level.
Next Target is $0.35
Stop Loss: $0.078
Regards
Hexa

DODO/USDT LONG
DODO might repeat its growth history POPCAT
Watch for a breakout of the local resistance zone and its consolidation above it, and then you can enter the trade.

DODOUSDT 1W-TIMEFRAME ANALYSIS💥DODOUSDT 1W-TIMEFRAME ANALYSIS
💗Hello ladies and gentlemen
This is my new idea for 💥DODO
I hope my idea is clear
Support me by like and share thank you
Stay Safe💯💲💲💲
Good luck💰😍

DODO analysisDODO has formed a liquidity pool after the bearish CH at the bottom of the chart.
It is also placed below a resistance swap range.
We expect deeper drops from DODO.
If POI is reached, we can look for buy/long
Closing a daily candle below the invalidation level will violate the analysis
Note that the financial market is risky, so:
Do not enter any position without confirmation and trigger.
Do not enter a position without setting a stop.
Do not enter a position without capital management.
When we reach the first TP, save some profit and try to move the stop continuously in the direction of your profit.
If you have any comments please post them, comments will help us improve our performance
Thanks

DODO/USDT Secondary trend. Accumulation channel 08 2023Logarithm. Time frame 3 days.
Accumulation channel 15 months. The main step of dialing according to liquidity, 80%.
Local trend—descending wedge. Pivot zone from key support/resistance levels. The percentage for orientation is shown.
This idea is a continuation of a similar idea published a year ago at the beginning of the formation of the channel of the set with the exact zone of the set with a step of 80%. DODO/USDT Local work. Volume
Very long accumulation - 1.5 years. There is a stop loss long collection under the channel support. There is a volume set. Which will be distributed at cycle change.
Linear chart with no market noise.
Main trend
The main trend of this cryptocurrency can be traced in this idea published 1 year ago. Time frame 1 week.
DODO/USDT Major trend. Downward channel.

DODOUSDT 1D#DODO is ready for the next leg up. It has broken the MA100 on the daily chart and is now pressing the resistance zone. In case of breakout, the targets are:
$0.2461
$0.2805
$0.3105

DODO/USDT Main trend. Descending channelMain trend. Time frame 1 week. Logarithm.
Coinmarketcap: DODO
Line chart.
Local trend. Reversal zone.
DODO/USDT Local work. Volume
