[$DOGE] Memecoins on the rise - but what about [$MREO]
DOGE CRYPTOCAP:DOGE
NASDAQ:MREO
No financial advice.
For Entertainment purpose only.
Instead of chasing the crypto cycle - why not 'bet' on other assets with a realistic chance?
here is a potential alternative 60 day trade...
it is basically
CHAPTER 11 vs EPIC COMEBACK.
Key data points
Previous close
—
Open
—
Day's range
—
About Market Cap DOGE, $
Coin

[$DOGE] Memecoins on the rise - but what about [$MREO]CRYPTOCAP:DOGE CRYPTOCAP:DOGE
NASDAQ:MREO
No financial advice.
For Entertainment purpose only.
Instead of chasing the crypto cycle - why not 'bet' on other assets with a realistic chance?
here is a potential alternative 60 day trade...
it is basically
CHAPTER 11 vs EPIC COMEBACK.

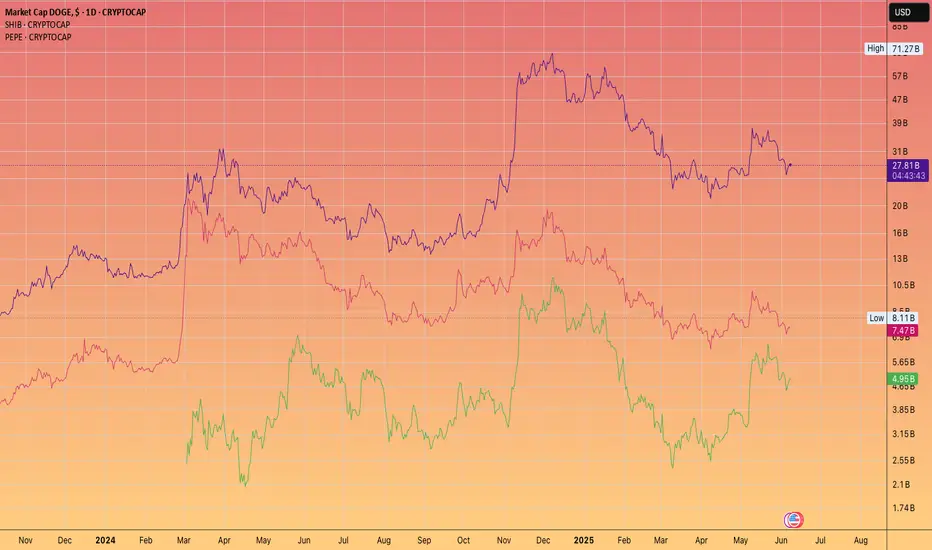
Pepe is going flip SHIB. But can it catch Dogecoin?If Ethereum were to smash $10k
Then it has a genuine chance IMHO
We shall be watching and tracking this as the cycle reaches it's mania phase!
DOGE|Bearish Triangle Formation On30-Min Chart-Breakdown Ahead?📉 DOGE Bearish Triangle Breakdown | 30-Min Chart
This chart highlights a classic *bearish triangle formation* in DOGE's market cap on the 30-minute timeframe. The pattern shows a series of lower highs with horizontal support around the 32.45B zone.
🔍 Key Observations:
- Pattern: Bearish Triangle
-

Doge top signalHTF doge always blasts off top, somewhat crossing BTC's price delta when there's a macro top. might be a good added signal to look at for timing the market tops.


dogecoin bullish biasi anticipate that dogecoin will continue dropping down to the key surport zones that i have highlighted on the chart, before it gains the bullish momentum within those key zones highlited.

DOGE Market Cap – 30-Min Long Trade Setup !📌🚀📈
🔹 Asset: DOGE Market Cap ($)
🔹 Timeframe: 30-Min Chart
🔹 Setup Type: Bullish Breakout Trade
📌 Trade Plan (Long Position)
✅ Entry Zone: Above 29.29B (Breakout Confirmation)
✅ Stop-Loss (SL): Below 28.52B (Invalidation Level)
🎯 Take Profit Targets:
📌 TP1: 30.38B (First Resistance Level)
📌 TP2:

DOGE/USD – 30-Min Long Trade Setup!📈 🚀
🔹 Asset: Dogecoin (DOGE/USD)
🔹 Timeframe: 30-Min Chart
🔹 Setup Type: Bullish Reversal
📌 Trade Plan (Long Position)
✅ Entry: Above $27.85B (Breakout Confirmation)
✅ Stop-Loss: Below $27.29B (Break of Support)
🎯 Targets:
📌 TP1: $28.86B (First Resistance Level)
📌 TP2: $29.84B (Extended Bullish Mov


See all ideas
Summarizing what the indicators are suggesting.
Oscillators
Neutral
SellBuy
Strong sellStrong buy
Strong sellSellNeutralBuyStrong buy
Oscillators
Neutral
SellBuy
Strong sellStrong buy
Strong sellSellNeutralBuyStrong buy
Summary
Neutral
SellBuy
Strong sellStrong buy
Strong sellSellNeutralBuyStrong buy
Summary
Neutral
SellBuy
Strong sellStrong buy
Strong sellSellNeutralBuyStrong buy
Summary
Neutral
SellBuy
Strong sellStrong buy
Strong sellSellNeutralBuyStrong buy
Moving Averages
Neutral
SellBuy
Strong sellStrong buy
Strong sellSellNeutralBuyStrong buy
Moving Averages
Neutral
SellBuy
Strong sellStrong buy
Strong sellSellNeutralBuyStrong buy
Displays a symbol's price movements over previous years to identify recurring trends.