Moon soonIm already loaded with Doge and if it goes lower i buy more, here is some of my targets for august/september. Im very bullish on this coin and think this is going to be one of the first coins in altseason rising.
DOGEBTC trade ideas


Dalam 1bulan kedepan doge meningkatDoge akan meningkat hingga 2 kali lipat dalam 1bulan kedepan, walau ada beberapa koreksi, kemungkinan akan menuju target pertama yaitu 85-90 doge kemudian akan mengalami koreksi

DOGEBTC AnalysisBullish ride for DOGEBTC...!!! Doge price gained support at the strong key level of 0.00000028BTC... check my arrows on the chart and know how best to join the bull train.
Follow me for more updates. Thank you.

Dogecoin/Bitcoin (July 18) #DOGE $DOGE #BTC $BTCDOGE found a strong support at 29sts and we can expect a nice pump to above 35sts in next days
With DOGE, no need Stoploss at this time because supports of DOGE is everywhere

DOGEBTC FUELING UPBTC bulls seem to be tired, we are under 4H MA(20) and 1D MA(20). 1M STOCHRSI is overbought.
What we need for DOGE moon is the sideway movement of BTC.
As you can see in the chart, it is hard to find a pattern for the puppy but for now 24sats is the new low for us.
Binance listing made DOGEBTC more powerfull than ever before. Next dogerun Up to 150 sats is what i expect.
Don't miss the last pump before the long doge bear season. BTC long bull run starts after 20K. Previous high was 1163$(01.12.2013) and it took 3years to recover it (01.01.2017) During this time doge mooned 4 times.
In the last period btw 20K$ ATH and the last ATH of 13,8K$ we've 3 Doge moon and we still have 1 more...
Good luck!

Ready for the next cycle DogeDoge is visiting the lower levels again. For over a month I've been watching and waiting for the red line to break out to fill my bags. Follow me, let's make money together.


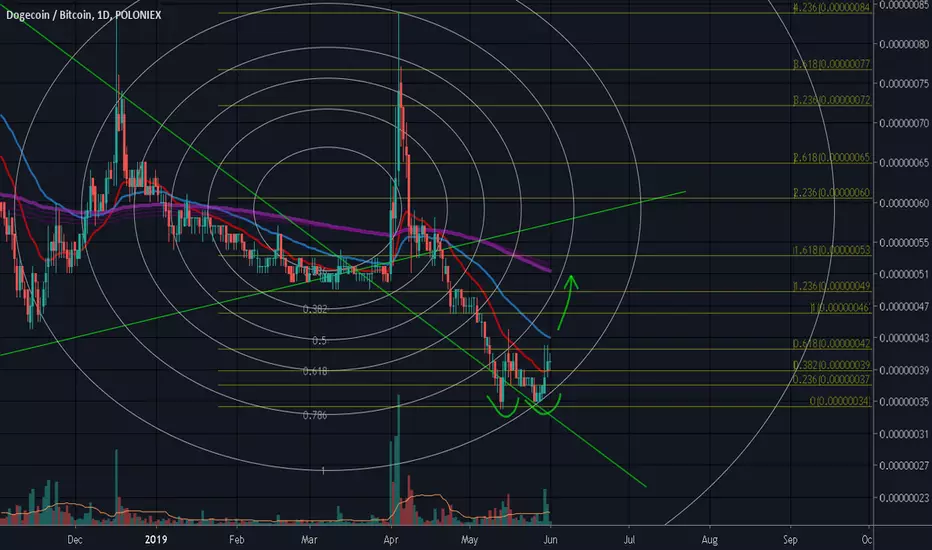
Doge/BTC Fibonacci Circle Projection.- Just experimental chart use FIbonacci Circle as i myself want to see how it's projected..
- I believe each circle play a part as a resistance and support. See the yellow circle... just like in december 2015 when price consolidate and hit the yellow circle as it's start a impulse upward. and act as resistance during the top of impulse movement around January 2016.
- it's seems DOGE/BTC holding the green trendline so good and act as a support until recent price action.
- Orange line is a golden fibonacci ( 1.618 x fib sequence) as a important point for linear support and resistance on wide time frame.
- mean while, Doge/btc also maintain it's support around 33 satoshi for now and 27 satoshi as a 2nd support.
- Interesting to see how this projection work on 11 august/ around that date when the price did hit the yellow circle.
even if there's nothing happen.. there's plenty of circle will be encounter in the future and i always love dogecoin :)
peace.


PUMPITso many alts looking ready to enter or already in inverse price discovery
doge out here looking magnetized by that inverse ATH


doge break resistenin the coin crypto doge btc great pump was waterpump coin ex wave tol exit 0.00000030-0.00000040 to fly over go a hits 0.00000060:0.00000088
roi profit 27%

DOGE looking for breakout.I'm digging into a great support level and a MACD bullish divergence. At least to 50 satoshis level.
Good trades to everyone, thank you for reading.

Doge/BTC Outlook.
After doge/btc forming a double bottom it just shot up a while above 21 EMA for now.
Resistance 50 EMA (42 satoshi)
resistance 200 EMA (53satoshi)
Resistance (optional) closing above previous longterm trendline (green) (59 satoshi)
support 20 EMA (39 satoshi)
support #2 +- (37 satoshi)
Indicators :
DMI : DMI + is crossing above DMI- indicate a buyer pressure is surging while DMX is still low indicate a low momentum strength for now as it will developed in near future.
MACD : MACD is pointing upward and ready to test a resistance to break into bullish territories (above the histogram) buyer histogram also higher than previous high which is a good sign for bull trend to developed.
DOGE/BTCTwice I've called alt season and twice I've failed.
Third time's the charm?
Alt charts should be making their way to the disbelief stage vs USD very soon, now that BTC has had its steep "sucker's rally".
I've seen the alt market act like this before, in December of 2017.
It appears the algorithms are using the same technique to hunt. Push down until there's no sellers left, then retest. Short term Adam & Eve.
Will the alt boom be as meteoric as December 2017?
Before, I was under the impression it would be a slow, tangent rise to the disbelief stage, but then we saw what BTC just did, so I looked back at the dot com bubble.
Same players, similar game.
Amazon, for example, took 40% of the time it took for its depression phase, to get to the top of the disbelief phase.
How does that look for alts? ~200 days of depression phase = ~80 days of uptrend to the top of the "sucker's rally".
Alts that are going to survive should be able to go to 35%-65% of their peaks of the bubble, in this phase.
DOGE, for example, peaked at $0.02, so it should be able to make it somewhere in the range of $0.007-$0.013 within this 3 month period.
While BTC falls value, into disbelief, this should show a 3-6x rally, relative to BTC.


