DOGE about to rally its way up againThe pattern this chart is showing you is happening over and over again. I believe that we almost are at the spot where DOGE can launch its way to the moon again.
DOGEBTC trade ideas


Doge new cycle incomming?Picture says it all, historically very strong support zone and against resistance line
Memecoin so yeah...

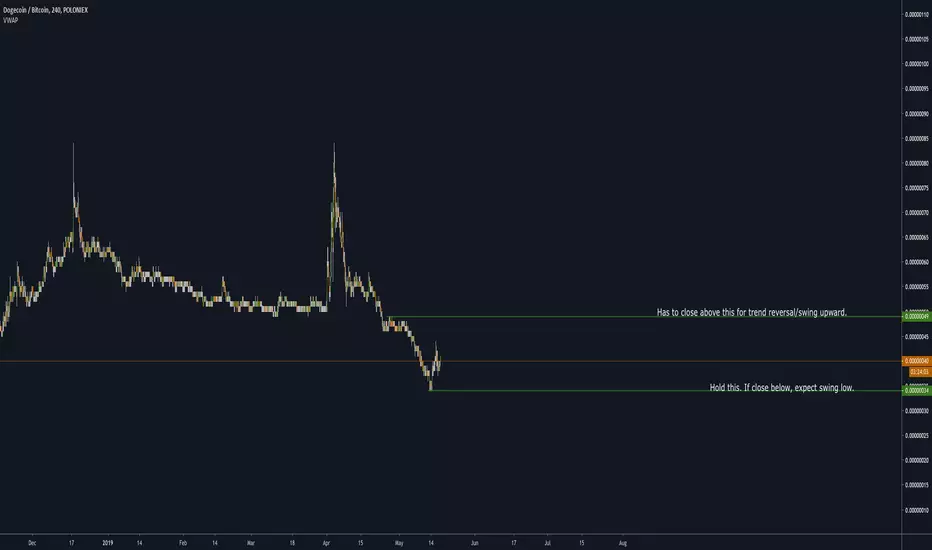
DOGEBTC - Had to do one for my DOGES - 4hr - DOGE BTC POLONIEXThe chart says what to expect. Personally, I have large bags of DOGE, probably WAY over exposed but I like the setup so far. Not financial advice. Trade safe.
Bitcoin a sequence of bubbles / the never ending bullrunsAbove you see the dogecoin / btc weekly chart from 2015 until 2019.
Interesting to see is that once and a while a bubble is popping out (mega bull run) from nothing and nowhere ... then bursts (bear period). Going back to were it belongs. Same is happening with bitcoin towards real currencies like USD, EUR and YEN. It inflates and deflates. Bitcoin and any other cryptocurrency has no intrisic value and it will never have. It will stay here yes but that doesn t mean it has value. Altcoins are derivatives from bitcoin and will always be. They will always be related to eachother.
One thing is for sure, with a chart like this you can make money. In fact it is simple. You buy or go long somewhere at the bottom and wait until it inflates again and fomo kicks in then sell it back to real fiat and make some good profit. Short when you see the bubble is starting to deflate and buy back at the bottom. Most interesting and intruiging part of the story is that at the end it doesn t matter IF you are buying 10%-20% above the bottom or short from the top because you KNOW that a bubble will pop out or crash at a certain point with much more percentage. You always will make PROFIT when you have patience.
We are now in a smaller bubble. It can go to 9000, 10000 maybe 11000 but from there it will implode / crash again. With some knowledge about behaviour of bitcoin and its children, indicators you can try and guess were the top and the bottom is. Not always easy but I am learning here in crypto.
Even with the bull run at the present, I think we are still in the BIG bubble from 20.000 USD and correct further to around 1000 within a year or 2. Now a subtop is created. I believe it can still go to 10000 or 11000 and run out of steam.
I started with crypto in 2018 and like most of us believed in crypto. Being a hodler for several months. Now however after much reading I get more insight and see what the truth is. Anyway the best traders are happy that the herd / retailers are moving the price up and down. It makes crypto very volatile and interesting to trade.
Hope you guys enjoyed the reading. Please hit the like bottom!


DOGE! DOGE! DOGE! Looks amazing. I just hope it's not a FAKE OUTI have this thing for DOGE, i dunno what it is but i just love it.
I've been waiting for this move for a while now but i hope this is not a fake out.
There is an interesting pattern in the DOGE cycles that i noticed. After each HL, DOGE has made 3 more lows retracing to 1.13 or 1.00. It is currently at the 1.618 fib time zone too, which is a sign that this pump could be significant.
I'm not saying it's a fake out and if it isn't i'm not sure how much it will retrace or even if it will retrace at all :)
Let's watch and see...


DOGE/BTCI've heard DOGE described as the Rambo of shitcoins.
It was one of the easier coins for the algorithms to take control of, but it is resilient and very promising.
I've seen DOGE accepted in several places, one of which was a private World of Warcraft server that I played on a while ago.
DOGE should survive mid-term. Long-term is still uncertain, but I see much in DOGE's future.
I mean, Elon Musk's favorite crypto and all... If that matters. Ha.

DOGE/BTC SO PUMP 100% min. SO LONGStoch RSI at 1D, 1W and 1M are at low level. So I trust in DOGE and buy it now. But anyway DYOR it's only my bet :)
RSI looks good too and it could break to a new high.


Elon Musk - New DOGE CEO!The world famous investor millionaire Elon Musk is the new CEO of DOGE. Good things come around. This is my minimum target, but most of my DOGE will hold for a period.


DOGE Progress - pump not overI believe the DOGE pump happened as part of the altcoin jump, and it's move isn't over.
Main position is long, with 15% of it scalping


DOGEBTC Pump is here Doge is breaking out of the bullish pennant. Target is the end of blue line. CCI is in bull zone

Buying the Dogecoin DipDescription: Elon Musk voted new CEO of Dogecoin or something
Timeframe: sell on Binance listing when CZ comes to clout chase or the ath resistance cluster
Indicators used: Pumpamentals, basic support and resistance
Shout out to: the SEC, Pierre Perignon

Waiting Doge againLuckily I managed to hit the last 4 doge pumps. If everything happens as expected, the next one is close, just a few more weeks / months (that's right, the Doge only barks at the right time, not a few days yet). My little orders are in the red boxes. Great order when you find the black line. See you in a few weeks.


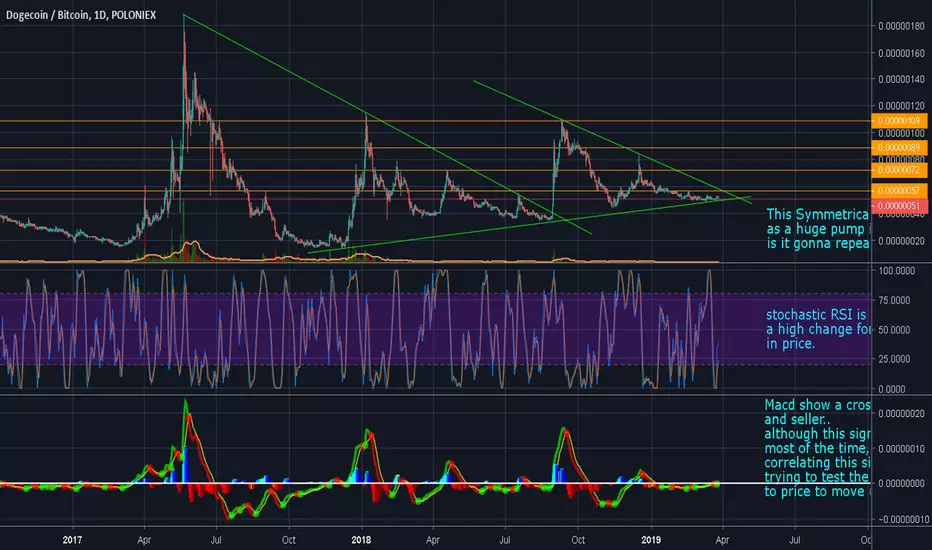
DOGE/BTC is it goin to repeat the last pump like before ??As the title said, there's might a repetition in price action may occur.
if it can breach 57 satoshi value it might break the symmetrical triangle and cause a pump in price.
if it doesnt expect a lower price around 43 satoshi as it's a huge support for the past price action.
peace...
DigiByte (DGB) +40% or -70%Target 1: 80 sat (+40%)
Target 3: 100 sat (+75%)
Target 3: 120 sat (+110%)
Buy & Hold target: 16 sat (-70%)

doge prolly 2xinghigher lows on both usd and btc pairs
last time that happened it 3xd
buy at 49-51 sell some at 80 and dont be surprised if it rolls to 120

Doge Bitcoin price cycle ideaJust some thoughts and analyze of Doge and it's cycles. I'm a long term hodler of my Doge bag, but will sell on pumps and buy on dumps during those cycles.
Only going to analyze the charts and how it looks at first sight, not using the indicators or anything else the volume.
Not in anyway investment advice, just some of my thoughts and analyze of what I see. DYOR!
My first public analyze so be nice ;P Will update over thread over time since it's long term
Here it goes:
1W Chart above
- Double Bottom
- LH and HL's, will next be a HL or a LL?
1D Chart Ascending Triangle
1D with a 3 drive pattern inside a Ascending Triangle, not with perfect fib levels on the 3 drive pattern.
- each Price Cycles 238 days.
Target: Triangle breakout / breakdown sometime during mid 2020, same period as BTC Halving
'3D Chart
3D Symetric triangle with LH (on shadows) and HL pattern.
- 225 days price cycle from top - top
Target: Next price cycle needs to break market structure and print a HH or any breakout / breakdown won't happen until mid 2020
Price channel on 3D Chart, needs to stay over channel support or it's invalid
