#DOGE/BTC Near buy zone base on historyCriteria (pump) :
1. Bullish divergence 1 day RSI
2. MACD line go to uptrend area
3. Price near last bottom (1) dan Price a bit bellow last bottom (2)
Target Buy 1 : 42000-45000 satoshi
Target Sell 1 : 50000-55000 satoshi
Target Buy 2 : 42000-45000 satoshi
Target Sell : up to 100,000 satoshi
Good luck
§†å†ue
DOGEBTC trade ideas

Mov Ave 100 Days acts as Resistance since Mid Jan 2019Mov Ave 100 Days (green Line) CAPPED any Rebound, so not much Volatility ahead as long below Green Line?


DOGECOIN Repeating Triangular Breakout Yet AGAIN?!Hello friends, hope ya'll are doing great! Let's get right to it..
Looks like Doge is about to repeat its historical pattern yet again. If you look at previous breakouts, you'll notice that most of the breakouts have a similar pattern; tightening bollinger bands and decreasing volume, followed by a massive breakout to the upside from within the triangle. Additionally, the EMA spread further indicates that the momentum is turning bullish. Looks like doge is ripening just fine to generate massive profits in the short term. If everything goes right, we should see a breakout within a week's time if anything. Notably, Doge has at times performed tremendously regardless of bitcoin's bull/bear movements so it is very likely this pattern is successful even if bitcoin tumbles. Lets find out what happens in the coming couple days. In my opinion, the price should hold to the current levels even if the action is delayed. All things considered, this looks like a considerably safe point to get in and get ready for the next wave up
Please hit a like and follow if you like this idea and want to stay updated! Also, comment if you'd like me to post charts for some other coins :). I might be posting charts for STORM/BTC, ZRX/BTC and SC/BTC soon cause they look ready for action as well!


I'm buyingLooks like it respects the uptrend line.
There is a clear RSI diversion.
By Easter, many people could get rich

DOGE long before pump Testing out a new strategy, historically tells me when a new trend will emerge. Got alert this morning that a move will happen within a couple days. Lets see.

DOGECOIN *massive* falling wedge (=bullish)so we got this "falling wedge" over multiple months.
very wedging frens
such coin
such wow
#doggonacci

Dos Posibles movimientos en Doge a Mediano PlazoEn lo personal aunque lo espero en los soportes mencionados en el gráfico para comprar, veo un patrón de triángulos simétricos, en donde el ultimo rompió al alza y este posiblemente pudiera hacer lo mismo; dejo los dos posibles panoramas, no es consejo de inversión o trade solo es mi apreciación del mercado, gracias.

An Examination of DOGEBTC Price Cycles, Pt. 1About a year ago, I told a friend that I'd discovered a cycle in the peaks of DOGEBTC. He agreed and later sent me a chart that had a similar interpretation as one I came across a few days ago by InvestingScope: I never looked at the cycles on a one week resolution so it was really neat to see our observation (the existence of a cycle) confirmed by someone else in a different way. Dunno how far down the rabbit hole I'll go with this but, here's a bit of my interpretation of the DOGEBTC cycle. Since charts are cool, I'll start there.... The first point of difference I have with the InvestingScope chart is the identification of a first peak. InvestingScope (and my friend) used Feb 10, 2014 @ 300 while I use Sep 7, 2014 @ 120 instead. My reason for rejecting the high on 2/10/2014 is simple: It doesn't fit my theory. Just kidding. Actually, I don't count it as the first for a number of reasons. I may discuss them in a future update or the comments section below, but for now, they are a distraction primarily because I end up with the same result either way. This might not be true for everyone else's theory though.
From peaks A to C there are 488 bars and peak B is roughly half way between the two. From E to G there are 476 bars, and peak F is roughly half way between the two. From peak C to peak E there are 480 bars, however there is not a corresponding peak D roughly halfway between the two . Because of this gap, it's easy to draw the same conclusion both InvestingScope and my friend did: that there is a recurring cycle of four peaks. However... before I get to that, there are a couple things I want to point out. Peak E seems to mark the point where DOGE transitioned from a downward slope to an upward one. And with the upward trend a new set of peaks (e,f,g) emerged. Peak (e) is roughly halfway between E and F, and peak (f) is roughly halfway between F and G:
And while peaks E, F, G progressively get smaller, peaks (e), (f), and (g) grow progressively higher with an average time of 101 bars after the larger peaks E, F, and G.
That's a clue if I ever saw one, so.... I looked to see if there were corresponding peaks (a), (b), and (c) about 101 bars after A, B, and C. Since DOGEBTC was trending down during this time, I would expect peaks (a), (b), and (c) to be flattened and harder to recognize. It wasn't too hard to find good candidates for (a) and (b) but (c) creates a dilemma. The 101 block is deserted and the best visual candidate is only 62 bars away. Forty bars is too much of a variation to be accepted without a good explanation as to why it was shortened by 40%. And the alternative, that the pattern dies during the 480 bars from C to E, needs just as much of an explanation.
Of course I have one. You've just got to wait until I make another cup of coffee. Take a gander at these while you wait:

Example of FibbyTenths indicator on DOGEBTCI recently put out an indicator entitled "FibbyTenths" and wanted to show a nice example of its usage. Here it is on DOGEBTC on the 1D chart. What are you looking at? Line 1.000 (pink) is a baseline from which all other levels are calculated. To get the 0.618 line (for example)= Baseline * 0.618. Pretty easy. As you can see, there are numerous examples of the price reversing direction from, or rebounding off, the 0.618 and 0.236 lines.

Doge - Sell when touch resistance zoneDOGE/BTC - wait for the price go up to higher resistance zone and sell from here !
Good luck for all !


DOGEBTC SWING TRADE UP TO 250% UPSIDE GREAT PLAYDOGEBTC SWING TRADE UP TO 250% UPSIDE GREAT PLAY. DETAILS - SEE CHART. BUT PATIENCE/TIME REQUIRED FOR A PROPER TRADE.

(1st idea ever, testing )Next market crash, remember DOGE. Woof.EVery market crash, OGs and semi OGs know, DOGE is the only safe haven, it wont pump usually in normal market conditions, but hey, who gaf, its like tether but for maximalists and with no scam, just the best meme ever created.
This is financial advice.
100%

(1st idea ever, testing )Next market crash, remember DOGE. Woof. EVery market crash, OGs and semi OGs know, DOGE is the only safe haven, it wont pump usually in normal market conditions, but hey, who gaf, its like tether but for maximalists and with no scam, just the best meme ever created.
This is financial advice.
100%

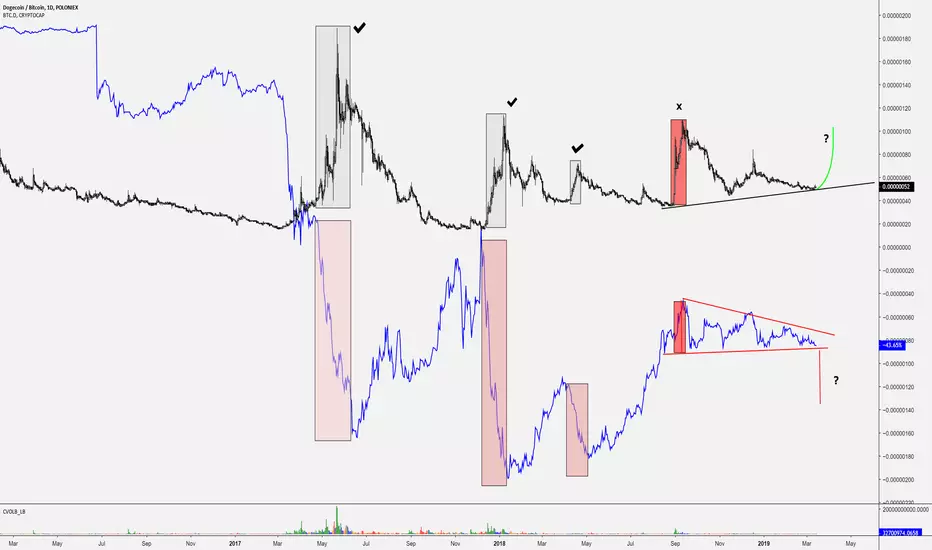
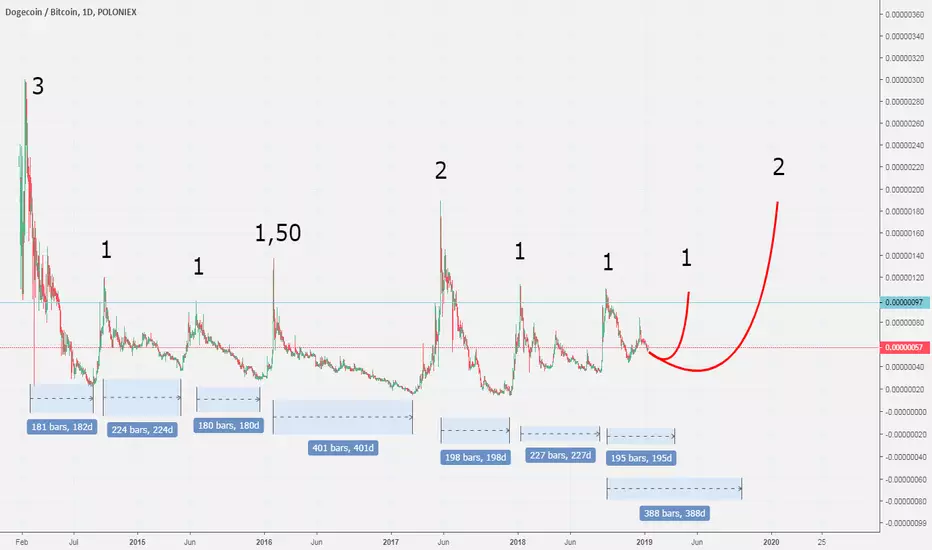
Dogecoin's stunning repetitive pattern.The coin that started out as a joke out of the Shiba memes has shown incredible strength and consistency throughout the years and in particular the current bear cycle.
A more careful look at the DOGE/BTC 1W chart, we can easily observe a stunning repetitive price action. This pattern drives the price to the Resistance zone with a frequency of 8 to 12 months, only to pull it back down to the Support zone. The rises to the highs (green candle sequence) are normally strong and quick, while the declines (red candle sequence) are slower. The similarities of the duration of each cycle as measured by the High - High distance are also shockingly identical. Just take a look at the bar measurements.
The last time a rise was observed was in August 2018 (second no 3 sequence) taking the pair two months to reach its high. As suggested by the pattern, the inevitable crash followed, which is not yet complete. Despite the up move since late November, the price should resume the downtrend towards the 0.00000035 - 0.00000028 Support zone and then rapidly rise towards the 0.00000120 - 0.00000137 Resistance zone.
** If you like our free content follow our profile (www.tradingview.com) to get more daily ideas. **
Comments and likes are greatly appreciated.

DOGE/BTC = SNAP CRACKLE nd POP/Dropim not advocating a doge position as this juncture, (but if you have bags, deposit to dump soon!), but doge/btc is actually an indicator for ltc/usd / ltc/btc and indirectly one for btc/usd, ltc/btc, eth/btc;
i used to mine this garbage, ive met the egod (doge backwards); and the coin itself is something humorous (shout out to wolong, NASCAR, and the Jamaican bobsled team for much wow). But the coin itself, is complete garbage. the only reason its useful is its total supply; (117,459,461,521 and counting, its infinite really, no cap, it isn't finite). it's the same concept with TRON/ETH (or at the current moment, WAVE/ETH for example). These shitcoins/tokens are useful in the sense they serve only to pump their complementing pair (not to say you cant flip any shit token/coin for ETH/BTC profit; entry/exit is everything). I hope this gives you insight on using more than your traditional TA; every crypto market is manipulated, the volume is fake; altcoins are no different; if anything, less regulated, on exchanges that never close, with no regulation (yet); so expect stupid coins to 3-5x+ (but when u read/see them, your buying the exit point/top).
these next 2 weeks will see some wicked swift divergences across all the crypto markets, best of luck!

DOGE/BTCBitcoin traded around the 72SAT and climbs up on the weekly chart. Despite the bear market and the fluctuations 40% raises are trying to break a possible ATH in the crypto market. Of course, at 50-50 risk it is hard to ignore the cyclical nature of this crptocurrency that started as a joke (this should not be seen as a trade recommendation).
