$DOGE CHARTING - 1H- TEST #3 (S/R ADJUSTED)PLEASE CORRECT ME IF I AM DOING SOMETHING WRONG, THANKS.
THIS IS NOT FINANCIAL ADVICE.
DOGEBTC trade ideas

$DOGEBTC: Moving as expectedWe've been pounding the table since the pullback and consolidation; chart setting up nice!
Holding that 0.0...75 is fire!
Next level of support 0.0..70 level
Possible retest to 0.0...87 in coming days.

$DOGE CHARTING - 30M - TEST #3PLEASE CORRECT ME IF I AM DOING SOMETHING WRONG, THANKS.
THIS IS NOT FINANCIAL ADVICE.

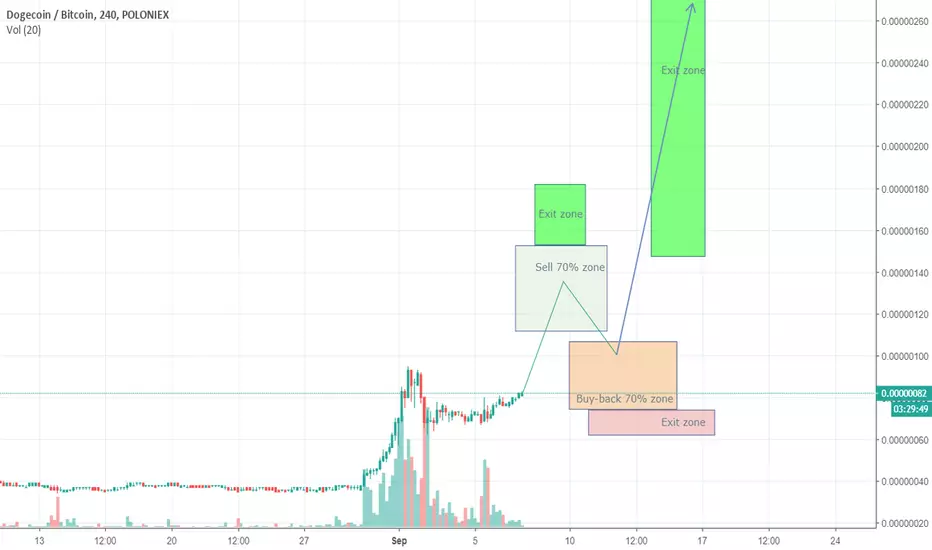
DOGEBTC 216% + 750% + In the long run!DOGEBTC 216% + 750% +
Hello everybody!
Especially for all fans of DOGE.
By the way I'm among them too.
The next growth of the coin made me try to make a global analysis of the whole life path. Moreover, my colleagues and I were just discussing the timing of the calculation of the time of operation of the forecasts.
For these purposes, I sometimes use a simple but convenient tool:
FIB TIME ZONE
The result of my research I suggest for review.
Any criticism is welcome.
All good luck and good trade.

Shaniko DOGE ideaI like to draw so I drew something on the chart.
I have no idea what I'm doing. Much science.
Only for study purposes or so.
I did not take into account:
- historical data
- massive dump over crypto
- behavior of whales (and shibas)
- how much coins I have
- that I like DOGE
DOGEBTC consolidating on low volumeChart was exhausted into the climatic volume. Consolidation is performing nicely on low volume with support levels holding in this minor sideways action. Maintaining above support 2 maintains bullish picture for me.


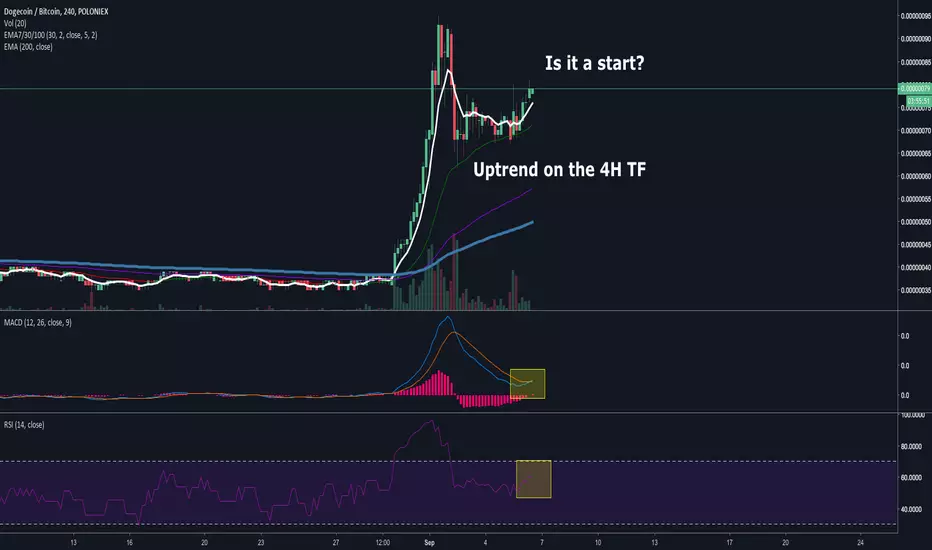
is there Dogecoin hype before hardfork?Yes it can be possible, I don't know what ATH we can see, maybe x5 or x3 in the near-term, or it can be a bull trap. Trade Indicators are so nice, the MACD would like to cross its signal line, the RSI > 50 but this deal can has a real risk when the Bitcoin price falls day by day.
Likes/Comments. Yes, please :)
$DOGEBTC has some "DOG" fight left in it.Update: 9/5/2018 10:00pm ET.
Chart performed well off support 1 and
trying to breakthrough resistance for
a potential run up to 0.0....80

Doge weekly squeezeDoge daily cross of trendline worked charm, now if same happens with weekly with small correction, will be as lit as dec 17 retesting 113sats.


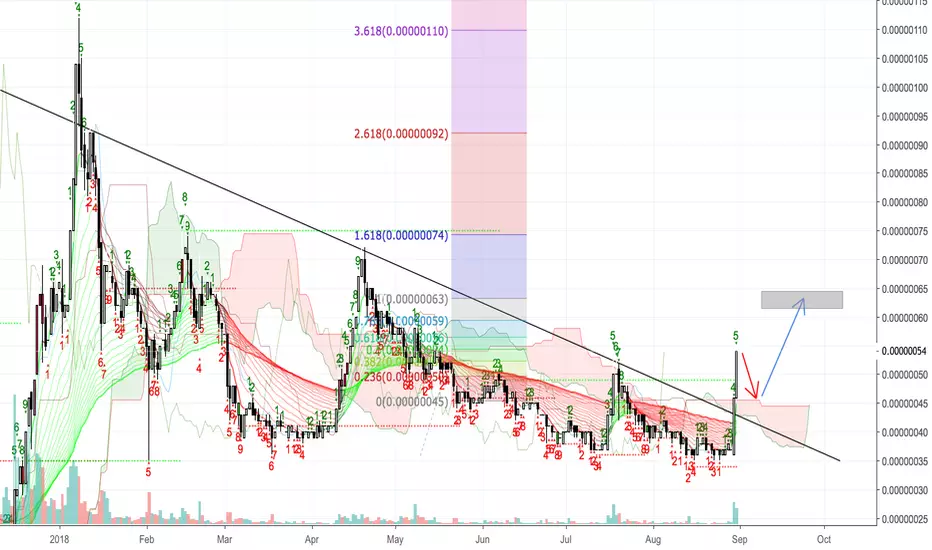
DOGE/BTC overboughtShort term (1-3 months) we won't see a new major phase break out until BTC hits hype phase. Until then, we're stuck in this yellow falling wedge. Too high too fast for this impulse; seems like a good sell.

Detailed Price Projection: Target 178, S/L 57: Go DOGE!I missed this boat, but now an active trade via 2.5% allocation.
Fractal dates: Aug 23, Sep 23, Oct 20, Dec 22, Feb 19'19, Mar 22'19, Aprl 21'19
Doge is looking good.
with 1-2 just triggered, we have a wave 3 coming, provided BTC does not screw us over.
my Entry is @64 and S/L at 59
Lets see if Doge will hit that target or not.
Good luck everyone ;)
**LEGENDS**
BLUE = Bear/Resistance
Yellow = Bull/ Support
~Explore the chart for possible scenarios of price actions - use zoom and scroll for better view.~
/*This information is not a recommendation to buy or sell. It is to be used for educational purposes only.*/
If you want your coin to be analysed, JUST ask.
If you got a question, ASK away!
And please keep those Stop losses in place!
Fractal dates are moments of interest, where price and time collide to create oscillation.
Thank you,
Ajion

DOGE goes mad , no dev coins getting attention [BTFD]so there is shite and then shitecoins
DOGE is certainly in that bag yet it can also be a great indicator to the market in general
MASSIVE bull signal days ago on this, which i was not able to catch personally been very busy out of the markets too, so the CoP qwent up into bull zone, RSI and Gann fann showing clear signs of bullishness....
if u wanna play with shitcoins i highly recommend using margins so u dont end up having to hold some piece of crap coin that u might not ever use or be able to sell again
so levels to watch using the fib are..
possible next bull move 112-118 and then possibly 150 on the next moves up
possible next bear moves 84, 75, 65, 54, 35 sats - depending on market u can possibly long from these positions
have a great weekend and even more powerful week, seems to be the weekend of the shitcoin, with RDD, BCN and others moving up
we are GIVING AWAY crypto coins in a competition in our telegram chat room, details below to join it.....
all u gotta do is guess which market/pairs the chart is from :) good spotting!

$DOGE CHARTING - 4H - TEST #2FOR MY EDUCATION/CHART LOGGING/POST-ANALYSIS.
PLEASE FEEL FREE TO ADVISE.
HERE TO LEARN AND EXPERIMENT.
Trying to figure out all the tools on the UI on my own, for now.
I'd appreciate any feedback/tips, etc. TY!

DOGE Breakout! Accumulation into public phase BREAKOUT!!!Buy doge because of high accumulation during the past few months showing smart money loading their bags and now it is breaking out above not only the 200 Day MA! (BTW every single time in doge's history a breakout above the 200day ma has been a super strong BUY! signal! I Can see doge easily hitting 100 sats off this breakout. And its breaking out of its triangle formation and it is creating higher FUCKING HIGHS BOYS! This is your time! DOGE CAN MOVE ALOT HIGHER!

Doge coin (DOGE/BTC) - Break out downtrendHI guys, look at the chart we will see Doge has break with good volume.
Doge has good time long enough for this break out so I think we need 1 small correction before bull run in next coming.
Thanks all you guys for reading and hope you lucky with this coin.
DOGE short ideaFirst of all, I would never short DOGE. But our favorite meme coin just had a big pump because of this news ethereumworldnews.com
So if you are a degenerate day trader, hell-bent on scraping your children's money supply and disappointing Jesus you could probably make 33% BTC profits shorting DOGE this month
Sell at: 46-47 satoshi
target: 34 satoshi
stop: 49 satoshi
risk/reward: 4:1
-M@
100% of donations go towards illegal drugs
BTC: 1K8U5Weva7MZHpxvNDpJGhzwR1xrYDajga

Dogecoin [DOGE] Price Prediction, Technical Analysis – SeptemberFirst of all, let’s discuss the technical analysis on the basis of 1h price forecast. After looking at the Moving Averages the 10-day Exponential Moving Average is 0.00000051 which is indicating a buy signal. Not only this the EMA (20), EMA (50) and EMA (100) whose values are 0.00000045, 0.00000042 and 0.00000043 respectively.
Continue to read more...

Time to buy Doge. September 2018I have been watching this for a while, have had an alert on the daily MACD to hit a point. It hit it today. If you are holding BTC it might be a good place to hold some. You can play this on margin on poloniex, like you can buy doge move it to margin account and use it to go long, compounding gains but if it goes against you, you also compound losses.
Buy between 38 and 41. Targets are 50, 59, 64 taken from fibs, expect a 50% retrace for every target. Stop under the long ass straight line it has been doing for ages.
This is the MACD it is going to pass the Zero line in the coming days and go green.

DOGE - The cycle continuesIs doge an indicator for the rest of the altcoin market? Let's look to the past to see how the market cycle could look in the future, if the pattern continues. Maybe an "alt season" is closer than we think.


A trading opportunity to buy in DOGEBTCTechnical analysis:
. DOGECOIN/BITCOIN is in a downtrend and the beginning of uptrend is expected.
. The price is below the 21-Day WEMA which acts as a dynamic resistance.
. The RSI is at 42.
. While the price downtrend in the Daily chart is not broken, bearish wave in price would continue .
Trading suggestion:
. There is a possibility of temporary retracement to suggested support zone (0.000000363 to 0.000000350). if so, traders can set orders based on Price Action and expect to reach short-term targets.
Beginning of entry zone (0.000000363)
Ending of entry zone (0.000000350)
Entry signal:
Signal to enter the market occurs when the price comes to "Buy zone" then forms one of the reversal patterns, whether "Bullish Engulfing" , "Hammer" or "Valley" in other words,
NO entry signal when the price comes to the zone BUT after any of the reversal patterns is formed in the zone.
To learn more about "Entry signal" and the special version of our "Price Action" strategy FOLLOW our lessons:
Take Profits:
TP1= @ 0.000000385
TP2= @ 0.000000412
TP3= @ 0.000000450
TP4= @ 0.000000482
TP5= @ 0.000000540
TP6= @ 0.000000656
TP7= @ 0.000000751
TP8= @ 0.000000921
TP9= @ 0.000001075
TP10= Free
