Doge BullDoge once again in position for swing trade. We can enter now, in search of the targets in black, if the orange line is broken.
DOGEBTC trade ideas

$DOGE CHARTING - 4H - TEST #1FOR MY EDUCATION/CHART LOGGING/POST-ANALYSIS.
PLEASE FEEL FREE TO ADVISE.
HERE TO LEARN AND EXPERIMENT.
Trying to figure out all the tools on the UI on my own, for now.
I'd appreciate any feedback/tips, etc. TY!


How To Trade DogecoinAs always, I like to take a look at the BIG PICTURE .
And for Dogecoin I see a fairly reliable sine wave.
We only skipped one wave at number 5.
Right now, we are at a critical support area, where it decides whether we skip the next sine wave or not.
We could see a basically 100% retracement like we did in the correction of wave 6.
I think O2 is more likely than O1.
And I actually think that if we see O1 and we don’t skip wave 8, that we will at least retrace to the yellow support line.
How To Trade:
Either way if we will see O1 or O2 I will use the same strategy.
I will enter the trade when we break through the 0.786 Fib (orange box)
And I will exit the trade at the 0.618 Fib (green box).
This results in about 55% profit in both cases.
And again I will use trailing stop losses in order to catch tops and bottoms.
More Updates/Details coming over the next couple of days.

DOGECOIN for this season pump before and after hard forkDOGECOIN for this season pump before and after hard fork will be happen in December

doge pumps rule I have just been looking at SEO traffic- then I checked my indicators and thats enough confluence or me. Long. Robinhood has Doge?!?!?! As well?!?!?! This is simply due to new entrants to see how very much fun time they all have with him.
Look at the Robinhood chat for dogecoin- epic

Another opportunity to buy in DOGEBTCTechnical analysis:
. DOGECOIN/BITCOIN is in a downtrend and the beginning of uptrend is expected.
. The price is below the 21-Day WEMA which acts as a dynamic resistance.
. The RSI is at 42.
Trading suggestion:
. The price is in a downtrend and we forecast the uptrend would begin.
. There is a possibility of temporary retracement to suggested support zone (0.000000385 to 0.000000348). if so, traders can set orders based on Price Action and expect to reach short-term targets.
Beginning of entry zone (0.000000385)
Ending of entry zone (0.000000348)
Entry signal:
Signal to enter the market occurs when the price comes to "Buy zone" then forms one of the reversal patterns, whether " Bullish Engulfing ", " Hammer " or " Valley " in other words,
NO entry signal when the price comes to the zone BUT after any of reversal patterns is formed in the zone.
To learn more about " Entry signal " and the special version of our " Price Action " strategy FOLLOW our lessons:
Take Profits:
TP1= @ 0.000000450
TP2= @ 0.000000482
TP3= @ 0.000000549
TP4= @ 0.000000664
TP5= @ 0.000000757
TP6= @ 0.000000921
TP7= @ 0.000001075
TP8= Free

DOGE/BTC LONGPrice making lower lows and indicator making higher lows> bullish divergence on 1hr,2hr,4hr
Long
buy under 0.00000045
Stop loss at 0.00000037
I'm a noob,playing safe. This is no financial advice. If anybody could correct me where wrong.cheers :)

DOGE / BTC weekly chart on approach to good buy zone [BTFD]DOGE come under 40 sats today again
35 is the bottom fib level and by looks of the gann fans we will bounce and go up
use fib levels to take profit where u can
peace

There is a trading opportunity to buy in DOGEBTC Technical analysis:
. DOGECOIN/BITCOIN is in a downtrend and the beginning of uptrend is expected.
. The price is below the 21-Day WEMA which acts as a dynamic resistance.
. The RSI is at 37.
. The RSI downtrend & The price downtrend in the daily chart are broken, so the probability of resumption of uptrend is increased.
Trading suggestion:
. The price is in a downtrend and we forecast the uptrend would begin.
. There is a possibility of temporary retracement to suggested support zone (0.000000385 to 0.000000348). if so, traders can set orders based on Price Action and expect to reach short-term targets.
Beginning of entry zone (0.000000385)
Ending of entry zone (0.000000348)
Entry signal:
Signal to enter the market occurs when the price comes to "Buy zone" then forms one of the reversal patterns, whether "Bullish Engulfing" , "Hammer" or "Valley" in other words,
NO entry signal when the price comes to the zone BUT after any of reversal patterns is formed in the zone.
To learn more about "Entry signal" and the special version of our "Price Action" strategy FOLLOW our lessons:
Take Profits:
TP1= @ 0.000000450
TP2= @ 0.000000482
TP3= @ 0.000000549
TP4= @ 0.000000664
TP5= @ 0.000000757
TP6= @ 0.000000921
TP7= @ 0.000001075
TP8= Free


DOGECOIN: MARKET RECOVERY - PROFIT = 27.03% !!!Our "Crypto Bottom" Trade Indicator has identified a buy in point on the 15th of July 2018 .
Using this buy in point and selling at today's peak price as identified by our NEW "Crypto Peak" Trade Indicator , you would have expected to net 27.03% PROFIT!!!
The price increase is the result of a recovery in the overall crypto markets.
***The "Crypto Bottom Signal" and "Crypto Peak Signal" used in this analysis is included as part of the Crypto Trade Signals subscription (check my signature for further details)***

Bull Doge! Week ChartWell ... We have managed to hit the last two BullRun Doge, will we get another ??? Fibonacci in the timeline indicates a high period. RSI, MACD, RSI Stoch on the weekly chart are pointing to a trend reversal. There is only strong resistance to being broken and start a powerful run up. I'm ready! Go GO Doge !!

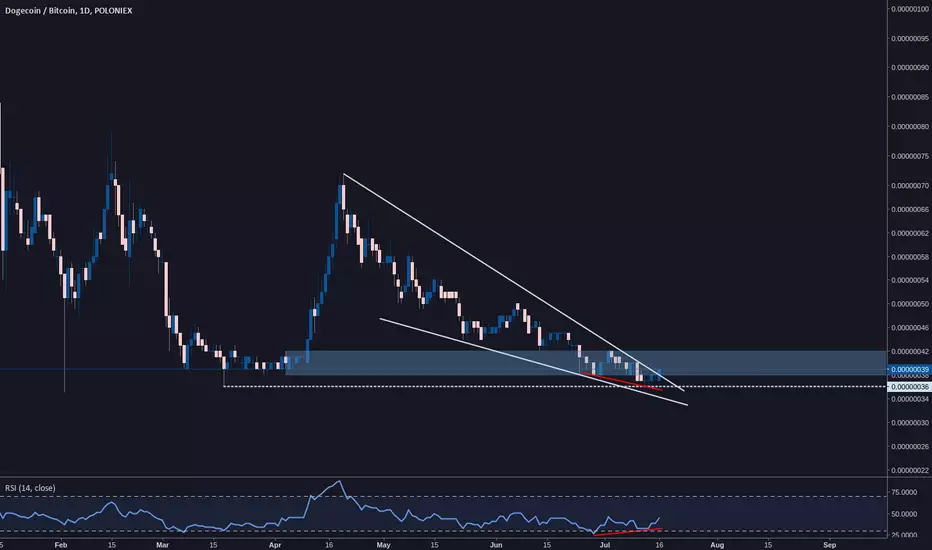
Doge could deliver more than 200% profit potential
Will this pattern play out ,probably
Maybe a lower low
I will give you a detailed analysis later on

DOGE/BTCVERY VERY CLOSE....
Be patient.
In April, DOGE began to pump before BTC... It started dumping at the end of April, before BTC started dumping at the beginning of May...
Market maker using DOGE to give a hint? Probably not...
This year's low on DOGE is 35 sats, so it might not be a bad idea to throw up some ladder buys if you prefer. Maybe 37, 32, 27 and 22...
I'd rather just wait for the insiders, personally. Buying the bottom and selling the top has never really worked out.


DOGE 450% PROFIT POTENTIAL IN SHORT TERM - CryptoManiac101DOGE is in good position but that does not mean you should let your guard down with Stop Loss.
Enjoy this trade advice my Crypto Maniacs, but remember to invest only what you can afford to lose or you're going right back to poverty on drop. We are not your financial advisors.


Cautiously optimistic on $dogeWe have a break out on the daily candles here. Lets see if it goes to 50sats or continues down.
