$DOGE is my favoriteSomething interesting may be on the horizon for #DOGE.
With the upcoming change in trend within #Bitcoin, we also seem to see more positive movements at $DOGE.
It is currently on the verge of breaking out. In the event of an outbreak, we may see a retest and then we could possibly assign the ATH to a test.
For me, CRYPTOCAP:DOGE has a lot of potential and I have a number of scenarios that I am currently considering.
In the past CRYPTOCAP:DOGE has gone into a kind of prerun x4 from the previous run and correction that has now also repeated itself. This means that with this run we can achieve a target of perhaps $1.5.
But before we do that and have certainty, we first have to break through a number of strong mental points.
Fib extend 1,618 at 70 cents exactly at the old ATH, fib extend around 1 dollar, which also counts as a magical limit, also seems like a difficult parkour to me. If that breaks, I expect a target of around 1.5 before we see a major correction.
If this happens, there is a chance that we could see completely different amounts in April. More about this later. For now I mainly want to see what we will do with the upcoming run.
Be kind to the world and each other
DOGEBTCB_353D32.USD trade ideas
Memecoins pioneer $DOGE is gearing up for its next run!#dogecoin is in final accumulation phase for mega bull season

(Elliott Wave) Double zigzag correction is just half way inGlobal inspection suggests that correction (monthly timeframe) has not yet reached even the minimum targets (marked with red lines on a logarithmic scale).
Local inspection suggests that correction is emerging in a double zigzag formation:
- First zigzag (W) reached the lowest point of $0.262
- Right now ugly wave (X) is forming (retraced 0.618 of wave (W))
- Expecting one more zigzag (Y) with least the same length of wave (W) potentially reaching $0.18 (aligns with weekly 50 EMA) with an on the way pullback near $0.28 (aligns with daily 200 EMA).

Doge's Journey to the MOON? $1.42 and Beyond Morning Trading Family
Hold onto your leashes, traders! If our 30 cents at supports holds firm, we're in for an epic ride:
First Stop: 50 cents - A nice little hop.
Next Leap: 61 cents - The momentum builds.
Gearing Up: 83 cents - We're picking up speed.
Moonshot: $1.42 - Aim for the stars!
Keep your eyes on the charts, and let's see where this meme coin takes us next!
If you found this useful: boost, share, like, and comment. I appreciate all the support! If you're struggling as a trader, I get it - I've been there myself. Jump in, send me a DM or head to my profile; I'm more than happy to help.
Kris/Mindbloome Exchange
Trade What You See

MEMECOIN LeaderDogecoin is going on another run and its just beginning
DOGE will be the leading meme coin as many more begin to emerge in this culture
Potential for massive increases as we are only at the position in the white circle
Very bullish

DOGECOIN W-shaped recovery targeting 0.39500Dogecoin / DOGEUSD is rising since yesterday and crossed today over its 1hour MA200, ahead of a Golden Cross.
This is technically a W-shaped recovery pattern and the current rally is the bullish wave that will complete it.
Buy and aim a little under Resistance A at 0.39500.
Follow us, like the idea and leave a comment below!!

Dogecoin (DOGE): Bullish Outlook – Key Levels🔥 Dogecoin’s Strategy:
🩸 Long: Above $0.3486, targeting $0.3969 and $0.4200 (strong upward momentum)
🩸 Short: Below $0.3486, targeting $0.3300 (watch for signs of reversal)
🔥 Dogecoin’s Commands:
🩸 Resistance: $0.3969 – Immediate resistance, if broken, we can target the $0.4200 region.
🩸 Support: $0.3486 – This level needs to hold for the bullish trend to continue. If broken, expect a potential pullback to $0.3300.
Market Context:
Dogecoin is in a solid bullish trend, with MACD and EMA indicators showing positive momentum. The price is above both the 50-period and 200-period EMAs, confirming a strong uptrend. The recent pullback could be a potential opportunity to buy, provided support at $0.3486 holds.
👑 "Seize the moment—strong trends don't wait." — FinCaesar

Doge is bullish - high possibility Doge is starting in a bulish short term.
--------------------------------------
based on this idea you can buy dogecoin above support zone.
this is a personal idea.
please do your own analysis before doing anything.

Same Pitchfan, but DOGE chartCo-ordinates of the pitchfan:
#1 (price, bar): 0.00019 -3747
#2 (price, bar): 0.00152 -3745
#3 (price, bar): 0.00020 -3726
The fan over time:
Sections of the pitchfan:
0.204
0.236
0.292
0.3264
0.382
0.472
0.618
0.764
the yellow line is my prediction in a sufficiently bullish scenario

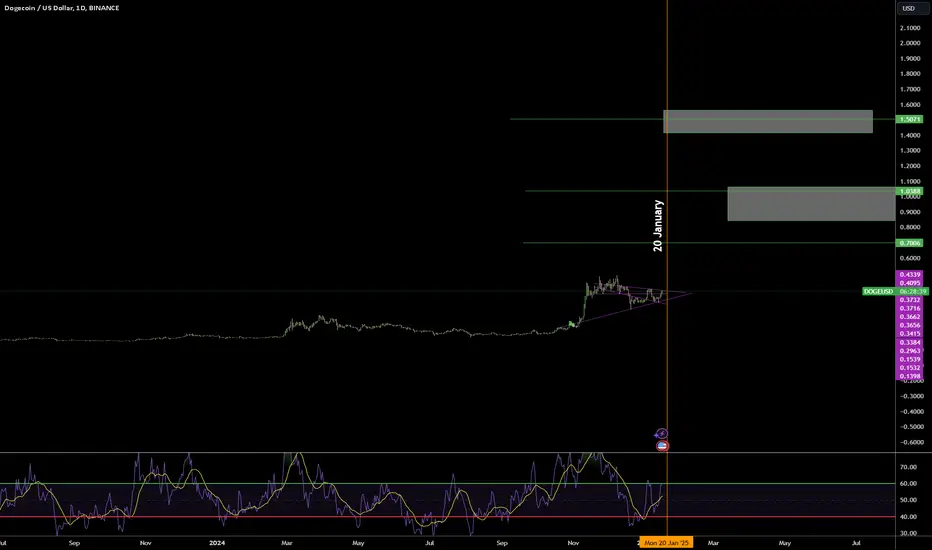
DOGEUSD: Typical prerally accumulation. Strong BUY.Dogecoin turned neutral on its 1D technical outlook (RSI = 45.150, MACD = -0.010, ADX = 26.634) as it tested the January 9th low. Technically this is a HL on the Channel Up that started after the December 20th 2024 bottom. The 1D RSI pattern looks very much like the last time it was trading on those (nearly) oversold levels after the August 5th 2024 bottom, as well as the time before that, the January 7th 2024 bottom.
All three are Channel Up patterns that were technical accumulations, separated in two phases. We have denoted those with the Arcs. In relative terms with those past patterns, we are currently at the end of accumulation phase 1, so the price should start rising to a new HH on the Channel Up. The past two patterns kickstarted a parabolic rally after that HH pullback, that marginally exceeded the 3.0 Fibonacci extension.
This projects that DOGE's long term target is the new 3.0 Fib from High to Low (TP = 1.6000).
See how our prior idea has worked out:
## If you like our free content follow our profile to get more daily ideas. ##
## Comments and likes are greatly appreciated. ##

Dogecoin - The Dog Is Still 100% Bullish!Dogecoin ( CRYPTO:DOGEUSD ) is still dominated by bulls:
Click chart above to see the detailed analysis👆🏻
I know, a lot of people are already freaking out about Dogecoin because of the recent dump of more than -25%. But we just witnessed a rally of more than +500%, so give this coin some room to breath. Everything remains 100% bullish, even if we see another short term pullback.
Levels to watch: $0.5, $0.2
Keep your long term vision,
Philip (BasicTrading)

Dodge ready for large moveDodge coin has a confluence of signals indicating potential bull move:
1) BOut Trend + Res
2) Test Support
3) Supertrend positive in D1 timeframe (not yet in W1)
4) Overall Crypto market gaining land.

DOGE most likely going Up trend After using the correction A,B and Fib tool with Daily Frame its shows the trend mostly likely going up to the point C and to FVG "Targets". but however if the trend goes down to take the remaining liquidity as shown in red box to move after up trends to the future target.
Note: Important news happen on 20 Jan 2025 of President Donald Trump taking the white house.So hope this make more liquidity get in market.
Do not forget to use your risk management!!

Dogecoin (DOGE): Potential for Further Decline or Rebound🔥 Potential Price Targets:
🩸 Near-term Goal: $0.3463 (1–2 months)
🩸 Long-term Goal: $0.2418 (3–5 months)
🔥 Dogecoin's Strategy:
🩸 Short: Below $0.3463, targeting $0.2418. Weakening momentum and potential breakdown could push the price lower.
🩸 Long: Above $0.3463, targeting $0.3800 and $0.3959. A bullish reversal is needed for sustained upward movement.
🔥 Dogecoin's Commands:
🩸 Resistance: $0.3959 — Key resistance level to watch; bulls must break above this to target $0.40 and beyond.
🩸 Support: $0.2418 — A crucial level for buyers to defend; breaking below this could lead to a deeper decline.
With the current MACD showing weakening momentum and price facing resistance near $0.3959, a further drop to $0.2418 is possible. However, a break above $0.3463 could signal a recovery toward higher targets.
👑 "In the world of crypto, the battle is between patience and precision. Choose your moment wisely." — FinCaesar


Dogecoin-DOGEUSD Periodic Analysis (Issue 60)The analyst believes that the price of Dogecoin will decrease in the next 24 Days. This prediction is based on quantitative analysis of the price trend.
Please note that the specified take-profit level does not imply a prediction that the price will reach that point. In this framework of analysis and trading, unlike the stop-loss, which is mandatory, setting a take-profit level is optional. Whether the price reaches the take-profit level or not is of no significance, as the results are calculated based on the start and end times. The take-profit level merely indicates the potential maximum price fluctuation within that time frame.

DOGEUSD Retests $0.26 Support: Bullish Continuation Ahead
DOGE/USD shows a robust bullish structure as the price consistently trades above the EMA Ribbon , which remains aligned to the upside. The market structure confirms two consecutive bullish break-of-structure ( BOS ) levels, further solidifying the current uptrend.
After breaking through the resistance at $0.26, the price has successfully retested this level, which now acts as support. As long as the price holds above this area, the bullish momentum is expected to continue, targeting the next key level at $0.56.
However, caution is advised. A daily close below the $0.22 level would invalidate the bullish scenario, indicating a potential shift in momentum and opening the door for a bearish move.
With the current setup, all eyes are on whether DOGE/USD will maintain its support and move toward the next target, or if it will fail to hold its levels.
👨🏻💻💭 What’s your take on this bullish structure? Share your thoughts below!
_________________________________________________________________
The information and publications within the 3Commas TradingView account are not meant to be and do not constitute financial, investment, trading, or other types of advice or recommendations supplied or endorsed by 3Commas and any of the parties acting on behalf of 3Commas, including its employees, contractors, ambassadors, etc.

Dogecoin (DOGE): Bearish Momentum Expected to Continue into Next🔥 Potential Price Targets for Next Month:
🩸 Near-term Goal: $0.32
🩸 Long-term Goal: $0.30
🔥 FinCaesar's Strategy:
🩸 Short: Below $0.35, targeting $0.32 and $0.30. The bearish MACD and consistent selling pressure support further downside.
🩸 Long: Above $0.40, aiming for $0.42 and $0.45. A reversal would need significant bullish momentum, which is uncertain at this time.
🔥 FinCaesar's Commands:
🩸 Resistance: $0.40 — The critical resistance level to overcome for a bullish shift.
🩸 Support: $0.30 — A break below this level could lead to accelerated declines.
Dogecoin faces ongoing bearish pressure with MACD momentum weakening. If the price fails to break above $0.40, further declines toward $0.30 remain likely as we move into the next month.
👑 "The future belongs to the decisive—take your shot now." — FinCaesar

Is DOGE ready for 1.00 USD: Spoiler, it's not. BUY/HOLD 500%.🔸Hello guys, today let's review daily price chart for DOGE. Currently pullback in progress, however price chart still looks strong with sequence of higher lows.
🔸Previously we had a nice run from 8 cents to 40 cents, 500% gains. Currently, reloading getting ready for a new bull run to trigger S/R zone at 1.00 USD, however consolidation is not complete yet, more time required.
🔸Recommended strategy bulls: BUY/HOLD low at/near 0.20 in the re-accumulation range in pullback/consolidation. TP bulls is 100 cents, 500% gains possible in this trade.
🎁Please hit the like button and
🎁Leave a comment to support our team!
RISK DISCLAIMER:
Trading Futures , Forex, CFDs and Stocks involves a risk of loss.
Please consider carefully if such trading is appropriate for you.
Past performance is not indicative of future results.
Always limit your leverage and use tight stop loss.

is correction still possible on dogeyes doge is still validated for a potential c wave down to take us to 0.17-0.22 we can verify that this correction should correspond with the DJI dip that we should see by the end of this week or by the start of next weeks opening on the DJI this is a shake out so it would be a fire sale at 0.22 so just dont be surprised if we get a sharp wick down then immediately recover.i am long in bigger picture

Doge(based on Neowave)now is the time to buy doge is offering a good price,soon it will start pumping to 4$

DOG/USD Rebounds from Key Ichimoku SupportFollowing an all-time high of US$0.4671 in early December 2024, Dogecoin (DOG) had printed a correction versus the US dollar (USD) and rebounded from the Ichimoku Cloud Support area. This support zone was formed following the Ichimoku’s Leading Span A (light green at US$0.3576) crossing above the Leading Span B (light orange at US$0.2965) in the final full trading week of December.
Conversion Line Confirmation
While a rebound from the Ichimoku Cloud Support has been seen, and price action has ventured above the Ichimoku Conversion Line (blue at US$0.3511) and the Base Line (red at US$0.3640), both of which are considered bullish signals, traders will still likely be cautious entering long at current levels. This is due to a concentrated area of resistance around the record high mentioned above and may deter buying at this point.
Price Direction?
Traders exercising caution at current levels will likely monitor the Conversion and Base Lines on the DOG/USD chart. The Conversion Line crossing above the Base Line is often observed as a bullish cue to seek long opportunities, particularly after a rebound from the Ichimoku Cloud. As a result, should the Conversion Line cross above the Base Line, buyers may attempt to challenge all-time highs and possibly tackle their way into unchartered territory.

DODGEUSD Long on Regression BreakDODGEUSD has broken the Downtrend over the holiday period.
May need more time to develop a trend as volumes will return today.
