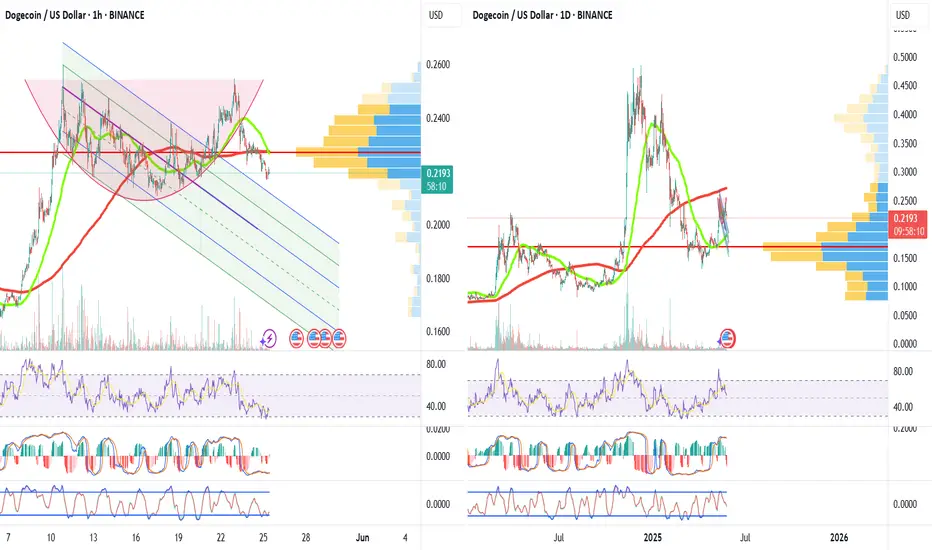
DOGE UpdateThe 1H chart is shaping up nicely, but the bounce zone is still unclear — patience is key. 👀
On the 1D chart, the MA50 is approaching a bullish crossover with the MA200, which could signal momentum toward a new ATH. 📊🚀
Stay sharp, stay ready. #Dogecoin #CryptoCharts #MA50 #MA200 #ATH
DOGEBTCB_353D32.USD trade ideas
DODGE COIN 4HRKey Drivers of Dogecoin (DOGE) Price Movement in 2025
Based on recent analyses and forecasts, the main factors driving Dogecoin’s price action include:
1. Market Sentiment and FOMO (Fear of Missing Out)
Dogecoin’s price is heavily influenced by retail investor sentiment and social media hype, leading to rapid rallies fueled by FOMO.
2. Historical Price Cycles and Technical Patterns
DOGE has shown cyclical price behavior with sharp rallies followed by consolidation phases, often moving within defined ascending channels.
Technical indicators suggest Dogecoin is entering a major bullish phase similar to previous cycles, potentially leading to prices around $2 by the end of 2025 and even higher by 2028.
3. Increasing Adoption and Ecosystem Development
Growing developer activity and expanding use cases strengthen Dogecoin’s ecosystem, boosting its utility and long-term value.
Although originally a meme coin, Dogecoin is increasingly considered for micropayments and tipping, enhancing its real-world usage.
4. Speculation Around ETFs and Institutional Interest
Speculation about potential approval of Dogecoin ETFs by major financial firms could bring institutional capital, increasing liquidity and driving prices higher.

DOGECOINKey Drivers of Dogecoin (DOGE) Price Movement in 2025
Based on recent analyses and forecasts, the main factors driving Dogecoin’s price action include:
1. Market Sentiment and FOMO (Fear of Missing Out)
Dogecoin’s price is heavily influenced by retail investor sentiment and social media hype, leading to rapid rallies fueled by FOMO.
2. Historical Price Cycles and Technical Patterns
DOGE has shown cyclical price behavior with sharp rallies followed by consolidation phases, often moving within defined ascending channels.
3. Increasing Adoption and Ecosystem Development
Growing developer activity and expanding use cases strengthen Dogecoin’s ecosystem, boosting its utility and long-term value.
Although originally a meme coin, Dogecoin is increasingly considered for micropayments and tipping, enhancing its real-world usage.
4. Speculation Around ETFs and Institutional Interest
Speculation about potential approval of Dogecoin ETFs by major financial firms could bring institutional capital, increasing liquidity and driving prices higher
5. Volatility and Market Corrections
Dogecoin remains highly volatile, with forecasts indicating possible short-term corrections or pullbacks after rallies, especially near resistance zones.
Conclusion
Dogecoin’s price in 2025 is expected to be shaped by a combination of strong retail-driven momentum, technical breakout patterns, growing adoption, and potential institutional inflows via ETFs.

DOGE/USD "DogeCoin vs U.S Dollar" Crypto Heist Plan (Day/Swing)🌟Hi! Hola! Ola! Bonjour! Hallo! Marhaba!🌟
Dear Money Makers & Robbers, 🤑 💰💸✈️
Based on 🔥Thief Trading style technical and fundamental analysis🔥, here is our master plan to heist the DOGE/USD "DogeCoin vs U.S Dollar" Crypto Market. Please adhere to the strategy I've outlined in the chart, which emphasizes long entry. Our aim is to escape near the high-risk ATR Line Zone. Risky level, overbought market, consolidation, trend reversal, trap at the level where traders and bearish robbers are stronger. 🏆💸"Take profit and treat yourself, traders. You deserve it!💪🏆🎉
Entry 📈 : "The heist is on! Wait for the MA breakout (0.19000) then make your move - Bullish profits await!"
however I advise to Place Buy stop orders above the Moving average (or) Place buy limit orders within a 15 or 30 minute timeframe most recent or swing, low or high level for Pullback entries.
📌I strongly advise you to set an "alert (Alarm)" on your chart so you can see when the breakout entry occurs.
Stop Loss 🛑: "🔊 Yo, listen up! 🗣️ If you're lookin' to get in on a buy stop order, don't even think about settin' that stop loss till after the breakout 🚀. You feel me? Now, if you're smart, you'll place that stop loss where I told you to 📍, but if you're a rebel, you can put it wherever you like 🤪 - just don't say I didn't warn you ⚠️. You're playin' with fire 🔥, and it's your risk, not mine 👊."
📍 Thief SL placed at the nearest/swing low level Using the 1H timeframe (0.16800) Day / Swing trade basis.
📍 SL is based on your risk of the trade, lot size and how many multiple orders you have to take.
🏴☠️Target 🎯: 0.21100 (or) Escape Before the Target
🧲Scalpers, take note 👀 : only scalp on the Long side. If you have a lot of money, you can go straight away; if not, you can join swing traders and carry out the robbery plan. Use trailing SL to safeguard your money 💰.
💰💵💸DOGE/USD "DogeCoin vs U.S Dollar" Crypto Market Heist Plan (Scalping/Day) is currently experiencing a bullishness,., driven by several key factors. .☝☝☝
📰🗞️Get & Read the Fundamental, Macro, COT Report, On Chain Analysis, Sentimental Outlook, Intermarket Analysis, Future trend targets... go ahead to check 👉👉👉🔗🔗🔗
⚠️Trading Alert : News Releases and Position Management 📰🗞️🚫🚏
As a reminder, news releases can have a significant impact on market prices and volatility. To minimize potential losses and protect your running positions,
we recommend the following:
Avoid taking new trades during news releases
Use trailing stop-loss orders to protect your running positions and lock in profits
💖Supporting our robbery plan 💥Hit the Boost Button💥 will enable us to effortlessly make and steal money 💰💵. Boost the strength of our robbery team. Every day in this market make money with ease by using the Thief Trading Style.🏆💪🤝❤️🎉🚀
I'll see you soon with another heist plan, so stay tuned 🤑🐱👤🤗🤩

DOGE to the moon?Classic cup and handle pattern already formed.
Price about 0.17-0.20 is good level to entry.

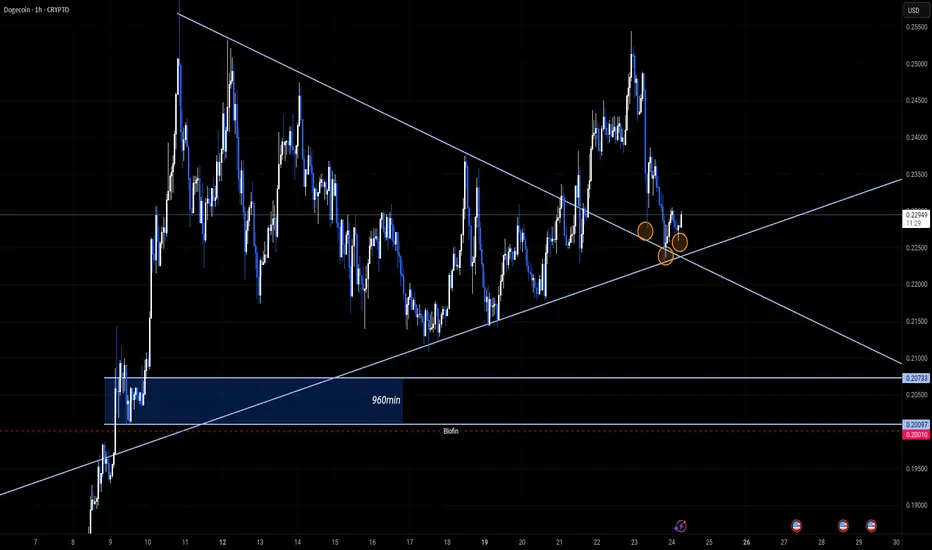
Bullish setup forming on $DOGE without retail interest.Bitcoin suggest further upside potential.
The bullish momentum appears robust, indicating a possible continuation of the upward trend.Altcoins: Altcoins are currently stagnant, showing little movement.
This flat performance may be attributed to retail investors' trauma from the 2021 cycle and recent market volatility, such as tariff-related concerns, which have likely dampened enthusiasm and participation.
Dogecoin (DOGE): On the 960-minute timeframe, DOGE is demonstrating strong demand, particularly if the price dips lower.
Currently, the price is retesting the recent breakout level.
The chart shows a support zone around the 0.02073 level and a descending trendline resistance being tested. If DOGE holds above the support and breaks above the trendline, it could signal a continuation of the breakout.
To end the analysis, the chart shows on the 60 min an immediate reverse head and shoulders pattern, very bullish on both the short and medium term.
However, a failure to hold support might lead to further downside.
DOGEUSD – Is Dogecoin About to Dump from Resistance?Dogecoin is approaching a major supply zone around $0.251, and bulls are showing signs of hesitation. After weeks of sideways chop, price has surged back into a well-tested resistance zone. Could this be the top before a sharp pullback?
Key Technical Zones:
Resistance/Supply: $0.245 – $0.251 (Heavy seller activity)
Key Support: $0.210 – If this breaks, expect acceleration.
Demand Zone: $0.178 – $0.185 – The last area of strong buyer defense.
Potential Setup:
Rejection at $0.251 = Short opportunity.
Break below $0.210 = Confirmation of bearish momentum.
Targeting $0.178 on sustained downside pressure.
Context:
RSI approaching overbought territory.
Historical rejection from this supply area.
U.S. economic calendar (see bottom of chart) could trigger volatility.
Bias: Bearish near-term unless DOGE closes firmly above $0.251.
DOGE Army or Smart Shorts – who wins this level?
Comment your take and let’s discuss the next move!
#DOGE #DOGEUSD #Dogecoin #CryptoAnalysis #Altcoins #TradingView #SupplyAndDemand #TechnicalAnalysis #CryptoTraders

DOGEUSD: Hasn't said its last word. $3 within reach.DOGE is bullish on its 1D technical outlook (RSI = 64.264, MACD = 0.014, ADX = 32.304) fueling a larger move on the 1M candle which last month rebounded exactly on the 1M MA50. This suggests that long term, Doge is on the very same spot as it was on both prior Cycles in February 2021 and September 2017. Both were the last lows before the end Cycle rally, which was on average +2600%. If it's repeated, Dogecoin can very well reach $3.00 by the end of the year.
See how our prior idea has worked out:
## If you like our free content follow our profile to get more daily ideas. ##
## Comments and likes are greatly appreciated. ##

DOGE - UP = PULLBACK AND UPGood Morning Doge Community,
Hope all is well. Showing a quick map of what has and is happening with DOGE. Just like the other cryptos we are seeing some good bullish momentum. With one final wave before a correction we can expect to go back up once support is determined.
Enjoy!

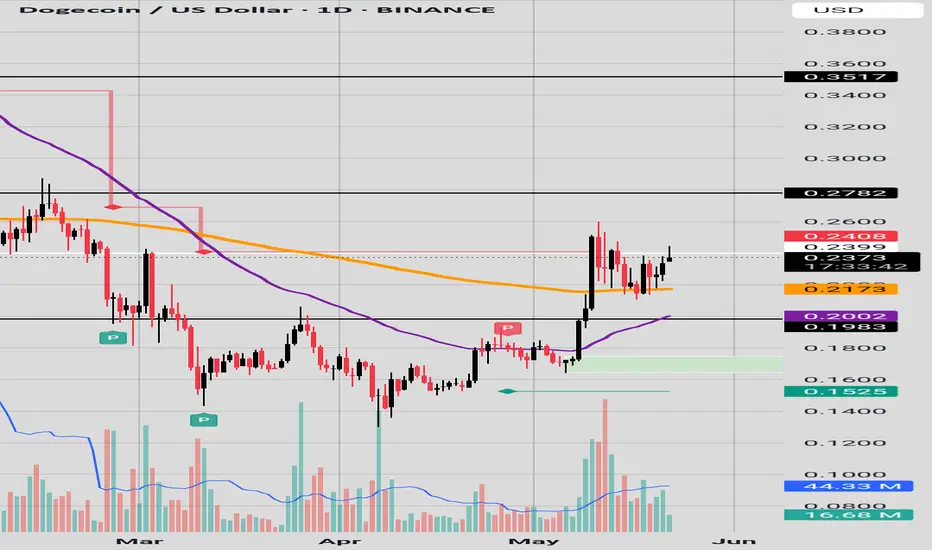
ResistancePrice appears to be consolidating between a key level 0.24 and above the 200 EMA (in orange) 0.2173 There is also possible future cross over of the 50 EMA(in purple) with the 200 EMA(in orange). For bullish activity we need price to make Higher Highs and Higher Lows from the .24 key level. Please be careful this crypto asset has been battling this resistance for a few candles. Have a safe day
DOGEUSD expectation 1HBull flag, wait for trend line break out for a buy to destination. Constent confirmation from bounce off from support, as well as respected long trend line.

Weekly trading plan for DOGEIn this idea I marked the important levels for this week and considered a few scenarios of price performance
It looks like the price is in a local triangle and it is worth considering the risks near the trend lines
Write a comment with your coins & hit the like button and I will make an analysis for you
The author's opinion may differ from yours,
Consider your risks.
Wish you successful trades ! mura

DOGEUSD: Is the Bull Run Over or Just Taking a Breather?Dogecoin is currently trading at $0.22577, stuck just below a major supply zone around $0.24. Price has been rejecting this zone multiple times, indicating strong seller interest.
Here’s what I’m watching:
Supply Zone @ $0.24009: Price failed to break above this zone, forming a potential double top—classic bearish signal.
Support Zone @ $0.19361: If price breaks down from current range, this is the first key demand level I’ll be watching.
Final Demand Zone @ $0.14083: Strong accumulation seen here historically. If we hit this level, I expect a sharp reaction.
Short-Term Bearish Bias: With multiple rejections at the top and decreasing momentum, DOGE might be gearing for a pullback towards $0.193 or even $0.140, especially if BTC shows weakness.
Plan:
Looking to short under $0.22 if bearish confirmation shows (e.g., break of minor support).
Potential long entries near $0.193 or $0.140, depending on price action.
Do you think DOGE will break $0.24 or are we heading lower first?
Drop your thoughts and trade setups below!
#Dogecoin #CryptoTrading #DOGEUSD #PriceAction #SupplyAndDemand #FrankFx #LuxAlgo

Doge History + FutureJust based on history and mathematic, I draw some lines and percentage. Maybe not your favorite but I see it my way.

DOGE monthly grows is hereIf we check Dogecoin on monthly timeframe and compare that to the previous cycle:
1) 20 & 50 MA on monthly held the price
2) The RSI level is too low and has a lot of room to growth to about 80 level
3) The support held
4) Six months growth gives October 2025
5) June & July most be pretty bullish

DOGE About to Explode? Key Levels to Watch!Yello, Paradisers! Are you watching #DOGE closely? Because a breakout is forming right in front of our eyes, and most traders won’t be ready for it.
💎After completing a clean ABC correction, DOGE formed an inverse head and shoulders pattern which is a classic bottom structure that has already initiated its breakout with a strong first push from the bulls. This was a major shift in sentiment, and momentum is clearly shifting in favor of buyers.
💎#DOGEUSDT is currently forming a bullish flag patten, a consolidation pattern that signals continuation rather than exhaustion. This ongoing flag has held firm over the past few days, and price is now coiling tighter, indicating that a fresh breakout is nearing. If the bulls maintain control, the next leg higher is about to be triggered.
💎The critical level to watch is $0.2325. A clean break above this resistance would activate the next impulse move, opening the door toward $0.250 as the first target, followed by $0.2620. That is where some profit-taking is likely to occur, but as long as bulls hold momentum, the rally is unlikely to stop there.
💎The full target of the bull flag formation extends into the $0.300–$0.3200 region. This area is not just a technical objective rather it’s also a strong horizontal resistance zone and aligns with the 61.8% Fibonacci retracement level from the previous move down. This convergence makes it a high-risk, high-reward area and a critical decision point for the market.
💎DOGE remains technically supported at the $0.2100 level, which has proven resilient during short-term pullbacks. Below that, both the EMA-200 and EMA-50 are providing additional support. These two moving averages are on the verge of forming a golden cross — one of the strongest signals in trend continuation analysis, reinforcing the medium-term bullish outlook.
Paradisers, strive for consistency, not quick profits. Treat the market as a businessman, not as a gambler.
MyCryptoParadise
iFeel the success🌴

$DOGE SCALPI believe we will see a increase in price. Cup and handle forming breaking out of a falling wedge. Looks very promising I will update regarding this one trade is active!

DOGE/USDT Technical Analysis – Weekly Chart
🔄 Falling Wedge Breakout + Rounded Bottom
The chart shows a confirmed breakout from a classic falling wedge pattern, combined with a rounded bottom formation, signaling a strong potential for trend reversal to the upside in the mid-to-long term.
📍 The circled zone highlights the breakout point where bullish momentum accelerated.
🧠 Key Technical Points:
Previous buy zone: Around $0.17–$0.20
Current price: ~$0.225
Trend outlook: Bullish (after breakout confirmation)
Pattern: Falling Wedge + Rounded Bottom – both bullish indicators
🎯 Potential Price Targets:
Target 1: $0.3757 – Initial resistance and likely short-term target
Target 2: $0.4884 – Previous high and probable profit-taking level
Target 3: $0.6160 – Full measured move from wedge breakout
⚠️ Risk Zone / Invalidations:
A strong drop back below $0.20 could invalidate the breakout.
Re-tests of support before continuation are possible.
✅ Summary:
Dogecoin (DOGE) has broken out of a falling wedge with a clear rounded bottom, indicating bullish strength. Holding above $0.22 could lead to a rally toward $0.37, $0.48, and possibly $0.61 in the coming weeks.

StructurePrice fell and picked up pace around the 100 EMA in black. We currently have price action above the 21 EMA(yellow). We need buyers to push price out of the parallel structure. And hopefully we can see 25 cents. Let's hope that price doesn't cycle down the parallel structure.

DogeCoin to $5 possibleYou can look at this chart the way you want to look at it. Bullish, bearish, sideways...or anything you like.
The way I am looking at this chart gives me a possible target of $5. Will I hold till 5? Probably not.

ActionWe have price moving in downward parallel channel to the 200 EMA in orange and close to a Demand Zone. Price action around the 0.2018 cents range will be very important due to EMA and Demand level and key level confluence.

DOGE - SHOWING SOME OVERBOUGHT, NOT OUT OF THE WOODS YETGood Morning Everyone,
DOGE is showing signs of being over bought. No this does not get us out of the woods yet.
on the 4HR we currently have one area of support which is still holding. We also have a secondary area of support on the hourly which is also holding. This is a good sign. However on the hourly chart our most recent movement was a rejection back down to test out supports.
We could expect some consolidation at this level and potential try to pierce that resistance or the price action will continue downwards.
ENJOY!

DOGE/USD Reversal Imminent? Watch These Key Levels!Dogecoin is currently testing a key demand zone around 0.21635 – 0.21500, where multiple rejections suggest strong buyer interest. The price bounced off this zone with bullish momentum, indicating a possible reversal setup.
Chart Highlights:
Demand Zone: 0.21500–0.21635 (marked in orange) – Strong buying interest seen here multiple times.
Current Price: 0.21878 (+0.44%) – Beginning a potential breakout move.
Resistance Levels to Watch:
0.22320 – Minor intraday resistance
0.22894 – Major supply zone (blue shaded area), previous rejection area
Bullish Signal: Bullish engulfing near support with increased volume, signaling possible continuation upward.
What to Expect:
A break above 0.22320 could push DOGE to retest the supply zone at 0.22894.
Conservative entry: on retest of 0.21635 with confirmation.
Aggressive entry: current price with a stop below 0.21500.
Trade Idea:
> Long Entry: Above 0.21900
Stop Loss: 0.21450
Take Profit 1: 0.22320
Take Profit 2: 0.22890
Bonus Tip: Watch the volume – increasing buying pressure could confirm this reversal. Break and close above the blue zone would indicate a shift in market structure.
---
Let me know in the comments if you're trading DOGE today and what levels you're watching! Don’t forget to like and follow for daily crypto insights!
#Dogecoin #CryptoTrading #LuxAlgo #TechnicalAnalysis #SupportAndResistance #ReversalSetup #Altcoins #CryptoTA #FrankFx14
