DOGEUSD Falling Wedge close to breaking towards $1.3Dogecoin / DOGEUSD is trading inside a Falling Wedge pattern which hit this week Support A and immediately rebounded.
The 1day RSI has made a Double Bottom and it is highly likely that we will see a steady recovery from now on.
If a break out above the Falling Wedge takes place, Doge will most likely start its final rally for this Cycle's Top.
We expect that to be on the 2.0 Fibonacci extension level, a typical reaction for such break outs.
Buy and target 1.3000.
Follow us, like the idea and leave a comment below!!
DOGEETH_E6A444.USD trade ideas

DOGE: Support and resistanceCOINBASE:DOGEUSD
hello,
Looks like almost bottom, but April might be bearish.
DCA into April may bring good returns.
Happy trading.

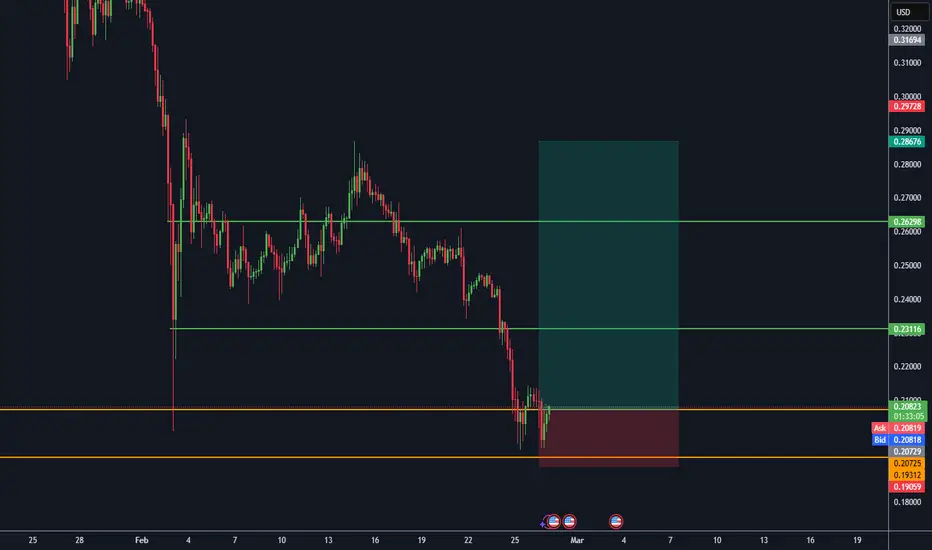
DOGE 4HR Analysis Here is the current 4 Hour range within the 1st zone I was looking for.
Personally, I still see more downside as bears are still in control. There is potential for a breakout on the 4HR but confirming congruence on the Daily has me hesitant as the Daily Timeframe would still hold a downward trend.
——————————————————————
Diving further into the structure of the candles I noticed there are more wicks from the bottom side of the candles than the top; a confirmation bears and the downward trend are still in control.
Bulls are starting to defend this level, but to me it’s a sign that buy side liquidity it being created.
If I’m a seller, this is a great place to manage risk for further downside.
If I’m a buyer, I’m being patient as the retracement back to supply seems to be almost over.

DOGE/USD Approaching Key Support Level. Price rebound to 0.4$ ?
Dogecoin is approaching a major key support level, perfect for a long opportunity. If this support breaks, we are cooked. Trade safe !
www.tradingview.com

Critical zone and supportsIt's clear that pulback to blue trendline is completed.
Other dynamic and static support is too indicated in chart.
Be hope to upward move.

MOON SHOT DUHObviously NOT financial advise... right?
In an unprecedented rally, Dogecoin has defied all odds and surged to a jaw-dropping $75! This chart dissects the explosive growth, highlighting key technical indicators and breakout points that signaled this historic rise. Dive into our analysis to understand the momentum behind Doge's stellar performance, and explore potential future movements. Whether you're a seasoned trader or new to the crypto scene, this chart offers valuable insights into how meme magic turned into a trading triumph. Let's decode the factors driving Doge to the moon and beyond! 🌟
#ALLJOKES #HAPPYINVESTING
#Dogecoin #CryptoTrading #MoonShot #TechnicalAnalysis #TradingView

Dogecoin - The Final Break And Retest!Dogecoin ( CRYPTO:DOGEUSD ) is confirming the final retest:
Click chart above to see the detailed analysis👆🏻
After we saw the textbook retest of the previous all time high about three months ago on Dogecoin, so far we also saw the expected correction of about -50%. However Dogecoin is about to confirm the bullish break and retest, which eventually leads to a parabolic rally and new highs.
Levels to watch: $0.2, $0.5, $5.0
Keep your long term vision,
Philip (BasicTrading)

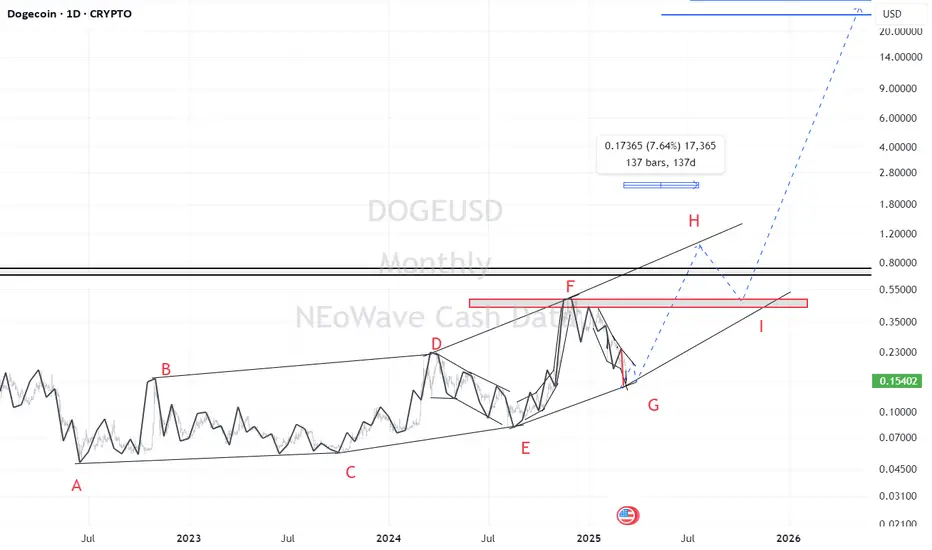
Doge(based on NEo wave)Doge is making a symmetrical which is a boring pattern and it takes too much time!
in about 150 days it will touch 0.90 _ 1 and after that a correction to 0.4_0.5 and after this it will pump too strong.
DOGE Approaching the Stage?DOGE may be getting ready for its rehearsal...
Price is currently sitting in the 1:1 pocket; along side a High-Volume Node (HVN).
HVN's typically act as strong support/resistance because they represent areas where a lot of market participants have already committed to positions.
With these two support structures (the 1:1 and HVN) price has the potential to bounce up from here to form a wave up and possibly a reversal.
-Not Financial Advice-

Cup and handle pattern in weekly timeframeThe target of this pattern is 4.5 $
It's on weekly timeframe.
15 cent is strong support.

Dogecoin will reach 2$Chart Analysis:
1. Timeframe and Price Context
Timeframe: Daily chart (each candlestick represents 1 day of trading).
Price Levels:
The current price is $0.1798, as indicated on the chart.
The price range on the chart spans from approximately $0.0800 (early 2024) to a peak near $0.3000 (late 2024), followed by a correction to the current level.
Trend Overview:
Early 2024: Dogecoin starts around $0.0800 and experiences a gradual uptrend with volatility, eventually rallying sharply.
Late 2024: The price peaks near $0.3000 before correcting downward into a consolidation phase.
Early 2025: The price is consolidating within a symmetrical triangle, with the current price at $0.1798.
2. Key Patterns and Annotations
Symmetrical Triangle:
The chart shows a symmetrical triangle pattern, which is a neutral consolidation pattern that typically signals a continuation of the prior trend (in this case, an uptrend).
Upper Trendline: A descending trendline starting from the $0.3000 peak, acting as resistance.
Lower Trendline: An ascending trendline starting from the $0.0800 low, acting as support.
The price is near the apex of the triangle, indicating an impending breakout (upward or downward).
Breakout Prediction:
An upward arrow with the annotation "TG 1 $5" suggests a bullish breakout targeting $5.00—a highly ambitious target representing a ~2,680% increase from the current price of $0.1798.
"FATE LOVES IRONY":
The image and text "FATE LOVES IRONY" (featuring a Doge meme with a spiral sun and flames) likely reflect a playful or ironic sentiment often associated with Dogecoin’s community. It may imply that despite Dogecoin’s origins as a meme coin, it could defy expectations with a massive rally—an ironic twist.
3. Support and Resistance Levels
Support:
The lower trendline of the symmetrical triangle (around $0.1400-$0.1600) has acted as support during the consolidation phase.
If this support breaks, the next significant level could be around $0.0800-$0.1000 (a prior support zone from early 2024).
Resistance:
The upper trendline of the triangle (around $0.2000-$0.2200) is the immediate resistance.
Beyond that, $0.3000 (the recent high) is a major resistance level.
The $5.00 target is a long-term, speculative goal far beyond current levels.
4. Volume and Momentum (Not Visible but Inferred)
Volume bars are not clearly visible, but typical behavior suggests:
Volume likely increased during the rally to $0.3000 and decreased during the consolidation phase within the triangle.
A breakout would require a volume spike to confirm, especially if the price breaks above the upper trendline (around $0.2000-$0.2200).
Momentum indicators (e.g., RSI or MACD) could indicate whether Dogecoin is oversold or showing bullish divergence, supporting a breakout.
5. Potential Scenarios
Bullish Breakout:
If Dogecoin breaks above the upper trendline (around $0.2000-$0.2200) with strong volume, it could confirm a bullish breakout.
The first target would likely be the prior high of $0.3000 (a ~67% move from $0.1798). The $5.00 target, while ambitious, would require extraordinary momentum, likely driven by significant market catalysts (e.g., meme coin hype, endorsements, or broader market rallies).
Bearish Breakdown:
If the price fails to break the upper trendline and instead drops below the lower trendline (around $0.1400-$0.1600), it could signal a bearish breakdown.
The next support at $0.0800-$0.1000 could be tested, potentially leading to further downside.
Consolidation:
If the price remains within the triangle (between $0.1600 and $0.2200), it might continue to consolidate until a catalyst triggers a breakout.
6. Market Context
Meme Coin Dynamics: Dogecoin is heavily influenced by retail sentiment, social media hype, and endorsements (e.g., from figures like Elon Musk). The "FATE LOVES IRONY" annotation captures the speculative and ironic nature of Dogecoin’s potential for massive gains despite its meme origins.
Broader Market Trends: Dogecoin often correlates with Bitcoin and Ethereum (as seen in your previous charts). If BTC and ETH break out (e.g., BTC to $120,000, ETH to $4,000), it could create a bullish environment for altcoins and meme coins like DOGE.
Timing: The chart’s position near the triangle’s apex suggests a breakout could occur within days to weeks on a daily timeframe.

DOGE close to the EMA 200!Doge has only dipped bellow the EMA 200 in bear markets. We are getting close to that level. It would be very profitable buying at that level or bellow. Get some coins now at this uncertain moment.

DogeCoin buy signal (DogeUSDT)Hello dear traders.
I just got a Dogecoin buy signal, and the chart is showing strong bullish momentum for the short term. Key indicators suggest an upward breakout, with increasing volume and positive price action. If the trend holds, we could see a solid move to the upside soon! 🚀I just got a Dogecoin buy signal, and the chart is showing strong bullish momentum for the short term. Key indicators suggest an upward breakout, with increasing volume and positive price action. If the trend holds, we could see a solid move to the upside soon! 🚀
Please do you own research before place a trade
What da' the dog doing?The idea is very self explanatory.
The chart is saying that it is the time for DOGE to fly again.
Doge needs to hold the ~20 cents zone for the rest of March.
April is around the corner. Every 4 years, it brings new surprises!

DOGE: Falling WedgeDOGE is showing a falling wedge pattern on the price action and the RSI. I'd expect a bounce by April.
Invalidated below $.14


Doge Weekly AnalysisStructure is still bullish on a weekly timeframe.
Looking at these areas to manage risk.
Once the market shows signs of reversal on a lower timeframe it’s hammer time.
What is hammer time?
A bullish Break of Structure or Change of Character on a timeframe of 4HR or above. Until then I am patient.

Expecting a bounce at the core of the Gaussian!Yes I believe we could be bouncing close to the core of the channel. It might be having some consolidation but at the core of the Gaussian is UP ONLY!
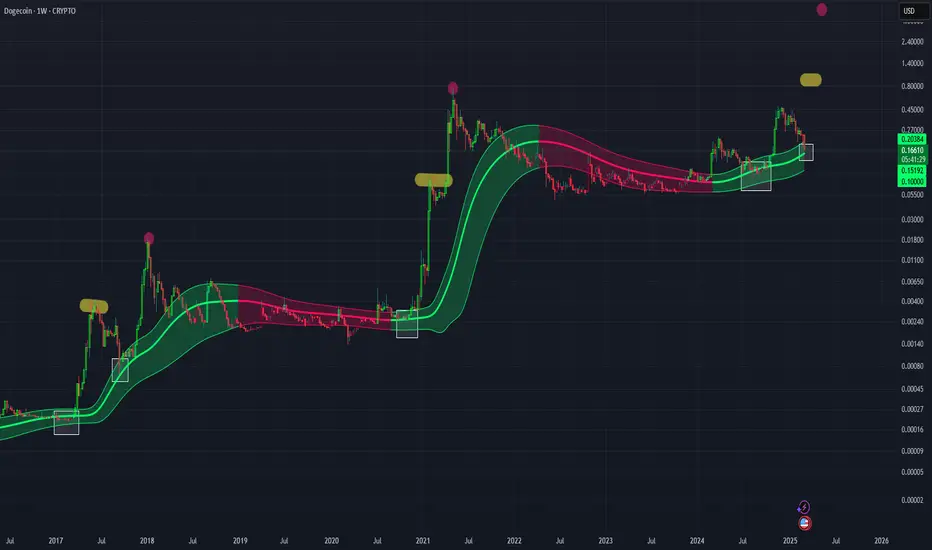
Dogecoin once in a lifetime opportunity to scoop more!I believe that Doge might be having one of the holy grail moments to get in and scoop even more. Looking like in 2017 when a correction made the the price dip bellow the guppy emas in a bull market trend (green emas). I am buying more for sure. Be greedy when others are fearful!

DOGE Strong BUY. Next stop $0.90Dogecoin / DOGEUSD is trading inside a Channel Up for exactly 1 year and the price is currently very close to its bottom.
The bearish wave is under the 1day MA200 with the 1day RSI oversold, which is exactly the conditions that were present on the August 5th 2024 bottom.
This is an excellent long term buy opportunity, potentially the last one that will lead DOGE to its Cycle Top.
The natural technical target is the 1.618 Fibonacci extension, which is what the prior bullish wave targeted.
Buy and target 0.9000.
Follow us, like the idea and leave a comment below!!

(DOGE) dogecoinfor dogecoin holders in the world to see a bit of pay per view imagery to make their mouth water. The colors, the picture, the imagery; ooh la la.

Predicting a run up into the 17th Pulling back into May.Don't panic, be prepared for extreme liquidations from over leveraged trades till all the pigs are slaughtered. Throw on your big ball trades But use a Support that wont break your bank

