THE TRUTH ABOUT DOGECOINDogecoin is looking really toppy. As you can see the RSI has peaked out early before a new high which is alarming. I think Doge is in serious trouble here as the meme craze starts to shift into newer memes. If the head and shoulders pattern plays out you're looking at a catastrophic drop down to 2 tenths of a penny. Doge is EXTREMELY overvalued and needs to come back down to earth. Don't forget there is close to 15 million Doge mined per day forever. It appears with the way the RSI peaked and price didn't break the high that Doge has reached a plateau in price even if the market cap continues to go up.
Not financial advice just my opinion.
DOGEUSD.P trade ideas

Doge is a LaggerHello I am the Cafe Trader.
Today we are looking at DOGE.
Normally I refuse to look at "Meme Coins" but with a 33 Billion Dollar Market cap, I don't think it falls into it's own category.
Doge, like many Crypto, have come alive. If this is one you are looking at, here are the Keys:
Short Term
A new seller did prevail as of July 23rd. It's important to note that they are still not in control of this rally. We need to see a key buyer get taken out first. This leads us to the scenario I have drawn.
Green Machine
Big buyers move markets... A lot. They can't buy what they want to buy on the open market without a reaction, so what do they do? Simple
Buy... then wait... then buy again near where they bought before.
So your "Strong buyer" is that area.
You have passive buyers looking to get a good price at 19.223 This would offer the greatest position for a reversal and a continuation.
Long
Entry - .19.250
Stop - .17.050
1st TP .24.050
2nd TP .28.600
Final TP .38.250
This should take at least a month. Be prepared to not look at it everyday.
Long Term
These prices should reflect your sentiment on DOGE.
Aggressive = .20.650
Good Price = .18.900 - 19.250
STEAL = 13.950 - 14.550
Thanks for reading, Don't forget to Boost and Follow !
Happy Trading
@thecafetrader

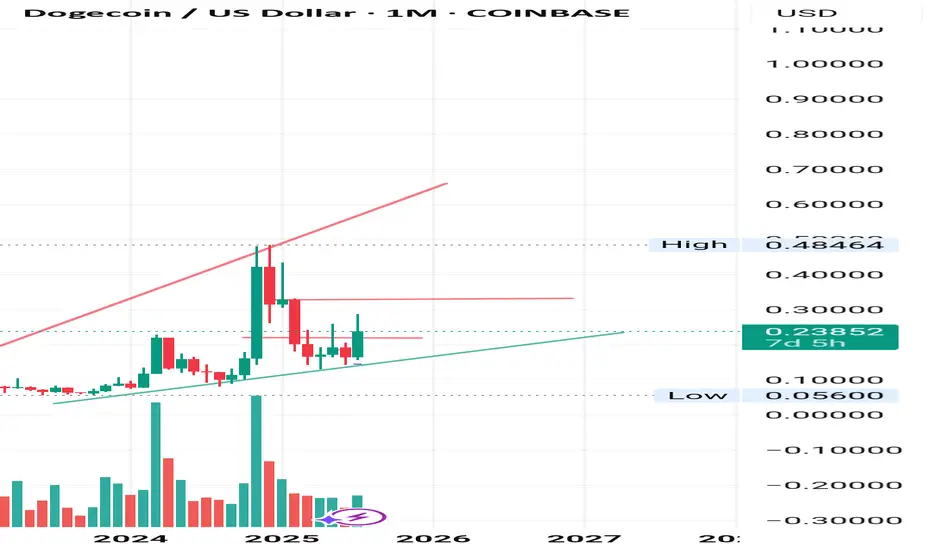
DOGEUSD Is that a textbook Livermore Cylinder to $1.5 ??Doge (DOGEUSD) has been trading within a Bullish Megaphone for the majority of its Bull Cycle since the October 09 2023 Low. We may technically claim that this has been so far one massive Accumulation Phase, along with the rest of the altcoin market.
A pattern that draws strong comparisons with that Megaphone has been 'Livermore's Accumulation Cylinder'. Jesse Livermore, an American stock trader, came with a revolutionary trading pattern a century ago, whose principles often apply perfectly to today's financial assets.
This is what we do on today's Dogecoin analysis, we apply this Accumulation Cyclinder on Doge's Bullish Megaphone. Even though not a perfect fit obviously, the main characteristics apply, with clearly visible Bullish and Bearish Legs.
Based on this model, the market is right now starting the aggressive break-out phase above the Cylinder. Technically the Accumulation is over and the price may pursue levels 8 and 9, which give price Targets of $1.50 and $12.00 respectively.
Now, even though $12.00 falls well after (6 months or so) the expected duration of the current Bull Cycle, $1.50 is well within its limits (October - November 2025) and exactly double the price of the previous Cycle High. This makes it a very attractive Top candidate.
So do you think Doge is inside a Livermore Cylinder that is about to break out parabolically?
-------------------------------------------------------------------------------
** Please LIKE 👍, FOLLOW ✅, SHARE 🙌 and COMMENT ✍ if you enjoy this idea! Also share your ideas and charts in the comments section below! This is best way to keep it relevant, support us, keep the content here free and allow the idea to reach as many people as possible. **
-------------------------------------------------------------------------------
💸💸💸💸💸💸
👇 👇 👇 👇 👇 👇

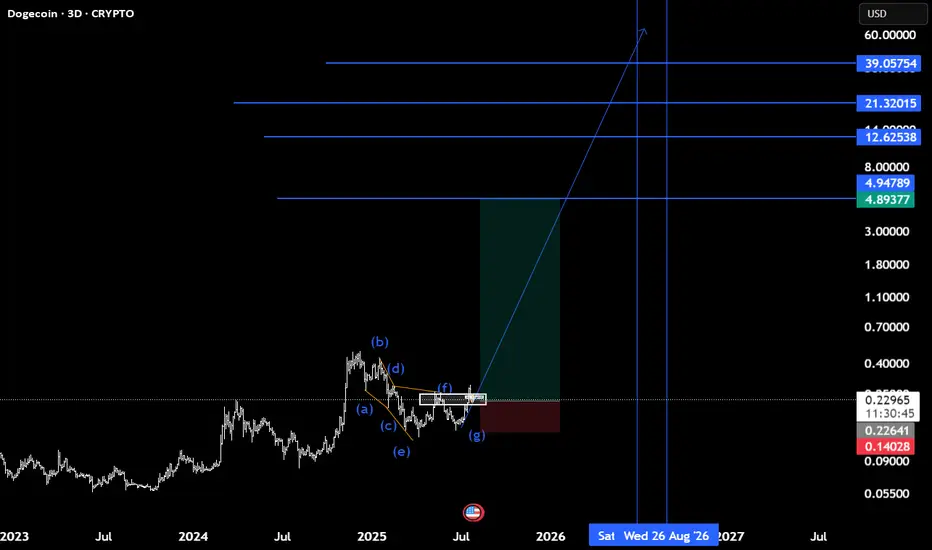
Doge(based on NEo wave)confirmation of finishing the E wave of triangle is here now.
it takes about 400 days for all targets to pass.
see the related last chart of doge.
Dogecoin - It is all totally expected!🐶Dogecoin ( CRYPTO:DOGEUSD ) will break out soon:
🔎Analysis summary:
Just this month, Dogecoin perfectly retested a significant confluence of support and is starting the expected rejection. With bullish momentum picking up, there is a very high chance that Dogecoin will break the all time high in the near future.
📝Levels to watch:
$0.5
🙏🏻#LONGTERMVISION
SwingTraderPhil

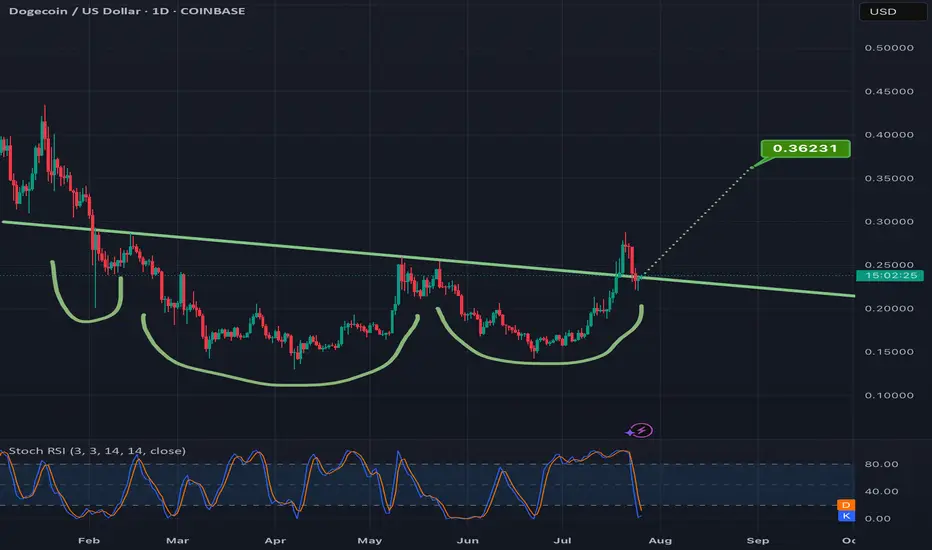
Confirming the breakout of this invh&s on doge can = 50% gainsAlready went above the neckline once and the current daily candle is currently back above the neckline for a second time. Hitting the full target would mean a good 50% gain from current price. *not financial advice*
Double bottom or fake outHopes of double bottom being formed from the 200 EMA(in orange), may evaporate if the 50 EMA(in blue) does not provide adequate support. Bulls need price and momentum to make Higher Highs from 0.23 area while bears want price to drop below 0.20.


DOGEUSD Has reached it's (first?) targetAfter reaching the Centerline, price eitheradvances to the Upper Extreme (U-MLH), or it reverses and it's target is the L-MLH, the lower Extreme of the Fork.
An Open & Close below the Centerline would indicate further progress to the downside.
A stop above the last high with a target around 2 would be the trade I would take.

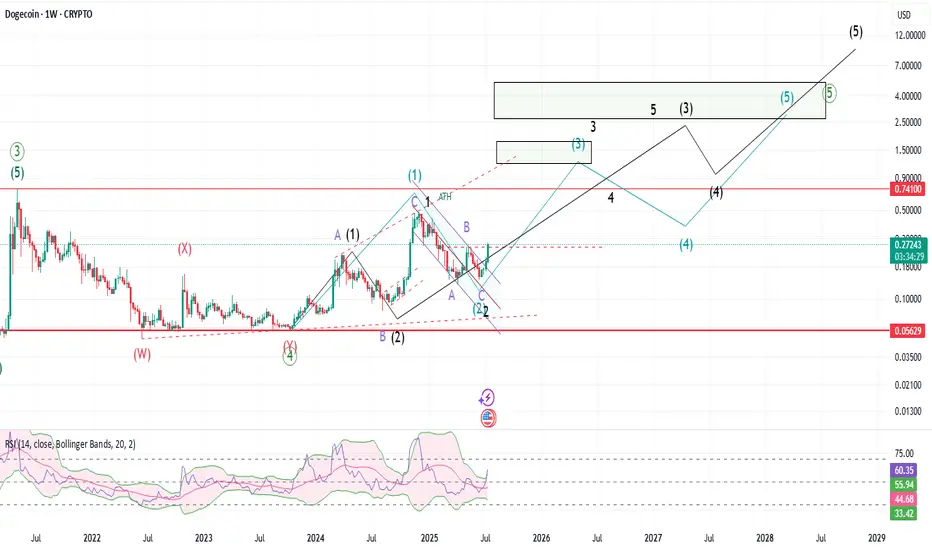
Doge: Tracking 2 counts; both bullishAfter breaking out of $0.27 Doge is poised to go to the next level at $0.49. Expecting a pullback to get in, but market may not provide a lot of time to think about it. At this point 2 counts are at play and both bullish.
Blue count: tracking an ending diagonal pattern. The two 5 waves moves; one from Oct 2023 low and one from Aug 2024 low could be a zigzag. Now we need to see how the wave 3 forms. If we see another 3 waves move that stalls between fib 1 to 1.236 extension ($1.2 - $ 1.7), and price falls below $0.49, then ending diagonal is most likely.
Black count: Instead of a zigzag, this count assumes we have a 1/2, 1/2 and primed for a 3 of 3 move. In this case, we should still expect a resistance at $1.2 but price should not break below $0.49. and the way the waves form would be a lot more impulsive.
Crypto market has a lot of tailwinds at the moment and might decouple from the overall markets. As rotation begins, on top of pent-up institutional demand, things might go crazy. Doge has a good use case with backing from Musk and his platforms.
Dogecoin flyinng soon!This is super speculative and I am positioned big on btc but I do have to admit I have been buying doge is the past bear market and I would like to see it close to 1 dollar or maybe more. This idea of doge gives a 1.36 top price

DOGEUSD – Rally Reversed, Drift In ProgressDOGE is now printing a clear lower high structure. After rejecting $0.271, price is stair-stepping down below the 200 SMA. Support around $0.258 has held (briefly). RSI at 37.00, still weak. Structure invalidates short only if bulls reclaim $0.265. As of now, every bounce is sold.
Doge inching above the double bottom necklineIt could easily dip back below the neckline a tie or two before it validates the breakout but definitely getting closer to doing so. Target is around 40-41cents. *not financial advice*
DOGE close to parabolic moveCrypto never sleepin’.
I drew this arc a long time ago for fun just in comparison to the last DOGE cycles back in 2023. It has been surreal to see it somewhat follow the curve just coming down to tag it in recent weeks. The entire history of this asset just looks like a cup n’ handle leading into another cup n’ handle to now another cup that might break out soon

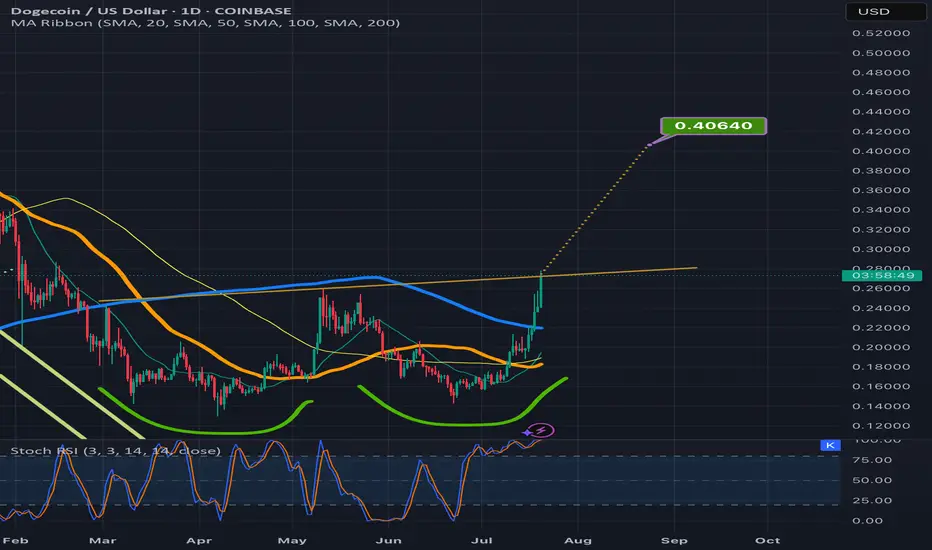
Doge update I'll be expecting a breakout to 0.33
If we can get past 0.35 I will be expecting a rally quickly.
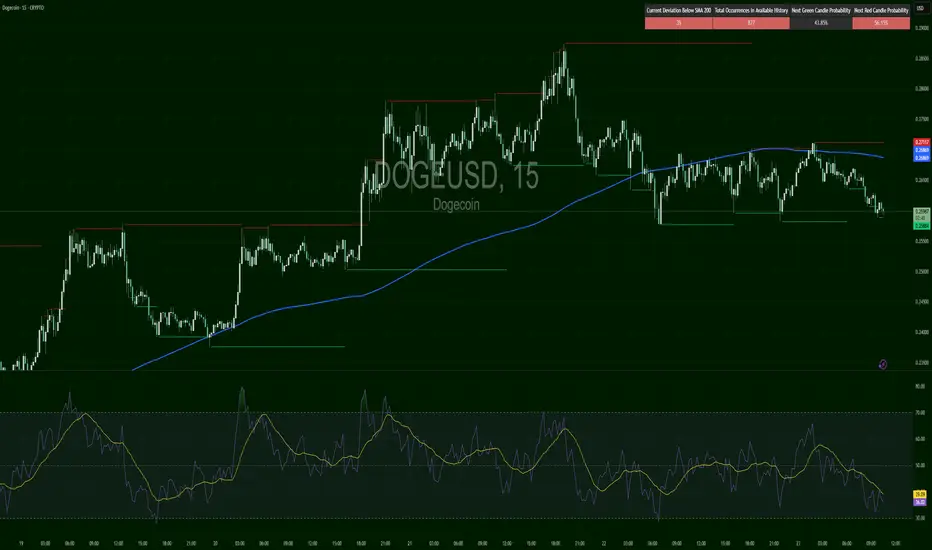
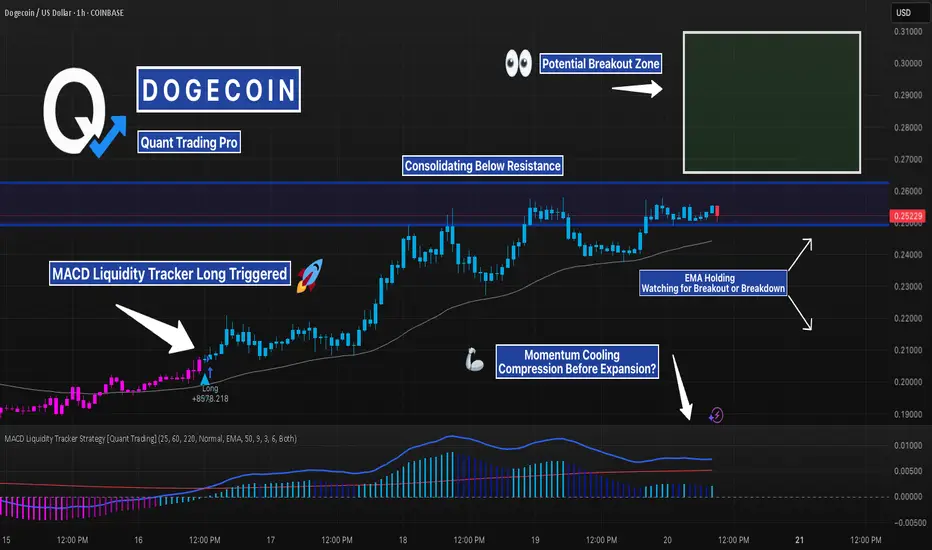
DOGE Coiling Below Resistance — Liquidity Tracker Already TriggeDOGE broke structure last week and pushed into a key resistance zone — but now price is going flat, consolidating just below breakout territory. This type of pause can either lead to continuation or a trap, and that’s exactly what we’re watching for.
The MACD Liquidity Tracker Strategy already triggered long earlier in the move, right around the $0.226 reclaim — a clean entry confirmed by bullish histogram shift, crossover, and trend alignment.
Since then, price has respected the EMA and gradually built up pressure just under the $0.257–0.270 zone.
The strength of this strategy is in combining MACD compression/expansion with trend filters, so it avoids whipsaw entries and only triggers when momentum AND structure align. This helps traders catch the beginning of a move — not the middle or end.
Right now, momentum is compressing again on lower timeframes, which often leads to a volatility expansion. The strategy is quiet for now, but the earlier long is still holding and valid.
We’re watching closely for a clean breakout above resistance — or signs of weakness that invalidate the move.
Whether this consolidates further or explodes from here, the setup has already shown how effective good filtering and timing can be.
DOGE 30m – Trendline Break + Bearish Divergence = Clean ReversalThis DOGE 30-minute chart offered a textbook reversal sequence:
Price was riding a clean ascending trendline with support from moving averages and strong bullish structure. But things shifted fast.
We saw:
– A clear MACD bearish divergence (momentum fading as price pushed higher)
– A trendline break and lower high, signaling loss of bullish control
– Former support flipped into resistance, confirming the structure shift
– Price now consolidating near the last major demand zone
If this zone breaks, expect continuation lower. If it holds, this could become a temporary bounce area — but momentum is clearly in the bears’ hands for now.
Zoom out for confluence and track price behavior around this zone for your next move.
#DOGE #CryptoTrading #TechnicalAnalysis #MACD #ReversalSetup #TrendlineBreak #SupportResistance #QuantTradingPro

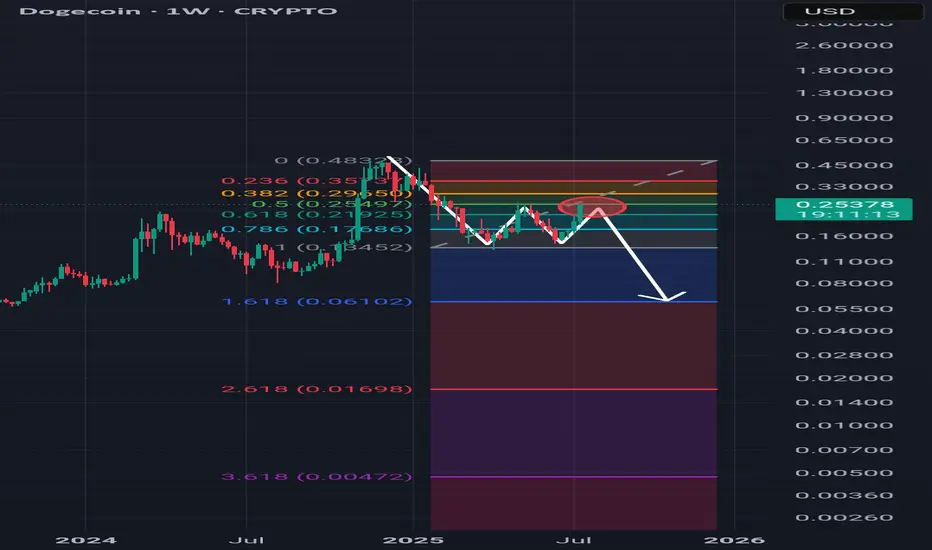
SaleDoge coin is in a corrective phase and there is a high possibility of a decline.
Warning, this is a dangerous area; they might get you into buying as After that, the price decreases.
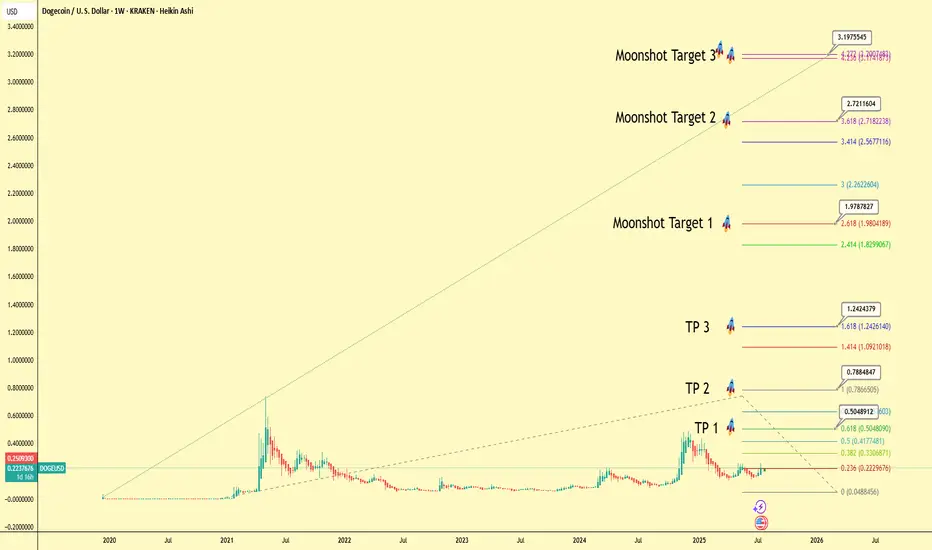
DOGE Macro Analysis: A Technical and Fundamental Blueprint to $3This analysis presents a long-term macro view for Dogecoin (DOGE/USD) using a daily Heikin Ashi chart to smooth out price action and better identify the underlying trend. The primary technical tool employed is a multi-year Fibonacci extension, a powerful instrument for projecting potential price targets in a trending market.
Based on the key swing low and high of the previous cycle, we have mapped out several conservative take-profit (TP) levels and more ambitious "Moonshot" targets.
The Technical Targets
The core of this projection lies in the Fibonacci extension levels. Assuming an entry or cost basis around the current consolidation level of $0.25, the potential targets are as follows:
TP 1 (0.618 Fib): $0.505 (+102% Profit)
TP 2 (1.000 Fib): $0.788 (+215% Profit)
TP 3 (1.618 Fib): $1.242 (+397% Profit)
Moonshot Targets
For longer-term holders, the upper Fibonacci levels suggest significant upside potential:
Moonshot Target 1 (2.618 Fib): $1.979 (+692% Profit)
Moonshot Target 2 (3.618 Fib): $2.721 (+988% Profit)
Moonshot Target 3 (4.236 Fib): $3.175 (+1170% Profit)
The Rationale: Why These Prices are Expected
This bullish outlook is supported by a combination of historical technical patterns and strengthening fundamental catalysts:
Historical Cycle Performance: In previous bull cycles, Dogecoin has shown a remarkable tendency to not just meet, but exceed standard Fibonacci targets, often running all the way to the 4.236 extension level. While past performance is not a guarantee, this historical precedent forms a strong basis for the "Moonshot Target 3" as a cycle peak objective.
Growing Institutional Legitimacy: The landscape for digital assets is maturing. Recent news about a major player filing with the SEC to list Dogecoin futures is a significant catalyst. Such a product would open the door for institutional capital, enhance liquidity, and provide a regulated pathway for investment, fundamentally increasing Dogecoin's legitimacy and market depth.
Renewed Investor Inflows: Dogecoin possesses one of the most resilient and loyal retail communities in cryptocurrency. As the market cycle progresses, the combination of re-energized retail interest and new institutional inflows could create a powerful demand-side shock, providing the fuel needed to reach these upper price targets.
Conclusion
This analysis outlines a clear, multi-stage roadmap for Dogecoin's potential path forward. The confluence of a historically reliable technical pattern (Fibonacci extension) and major fundamental catalysts (futures listing, broad investor interest) creates a compelling long-term thesis.
Disclaimer: This is a personal analysis and projection for educational purposes only. It is not financial advice. Always conduct your own research and manage your risk accordingly.
#Dogecoin #DOGE #Crypto #TechnicalAnalysis #Fibonacci #Altcoin #TradingView #ToTheMoon
DOGE - BULLRUN HERE!!!!The bull runs in 2017 and 2021 started after long periods of consolidation, followed by explosive impulsive growth.
The current setup in 2025 looks very similar to those previous bullish cycles.
I'm expecting a breakout above $0.50 and the beginning of a strong bull run for DOGE.
Targets: $1.50, $6.00.

DOGE to $2 before EOYCUP & Handle type formation on DOGE, really believe this can run to $2 during alt season which has just started firing its engines ...
BTC.D finally looks toppy.
📈 1. Technical breakout & chart patterns
DOGE has recently broken out of a long-term descending channel, forming a classic double-bottom pattern—a strong reversal signal.
It also cleared the key $0.20–$0.21 resistance zone, with on‑chain data pointing to rising futures/open interest and reduced sell pressure
⚖️ 2. Macro & regulatory tailwinds
The passage of the Genius Act in the U.S. House brought “clear‑cut regulation” for crypto, boosting confidence and driving DOGE higher—rising ~8% on the news
Broader crypto bull sentiment—fueled by possible Fed rate cuts and favorable legislation—has pushed altcoins like DOGE ahead this week
🧠 3. On‑chain & investor activity
Charts show increasing futures & spot trading volumes, along with expanding whale activity and holders staying profitable—collectively suggesting strong demand and low sell pressure
Network usage is also up: wallet interactions and momentum have accelerated as DOGE crosses these technical thresholds
💬 4. Community & utility factors
Dogecoin maintains a vibrant community, boating meme-driven social capital, plus occasional celebrity mentions (e.g., Elon Musk), keeping public attention
Its growing real-world usage in tipping, payments (e.g., Shopify, AMC, Tesla merch), and even institutional products—like the Grayscale Dogecoin Trust—adds fundamental backing

DOGE Smacks Into Old Supply — Is This the Top Again?DOGE just wicked into the same zone that triggered a major selloff two months ago. If it clears $0.275, things could get wild — but if history repeats, expect profit-takers to pile in fast. Watch this level like a hawk.
