DOGEUSD.P trade ideas

Why I Believe Dogecoin (DOGE) is Going to RiseAfter analyzing Dogecoin (DOGE), I believe it has significant potential to increase in value for a few key reasons:
Strong Community Support – Dogecoin has one of the most passionate and active communities in the crypto space. This strong support leads to continuous growth in awareness, use, and adoption, which drives its value up.
Increased Recognition – With more celebrities and influential figures like Elon Musk showing support, Dogecoin is getting the exposure it needs to stand out. This visibility is attracting new investors and users.
Use Cases in Transactions – While it started as a meme coin, Dogecoin has evolved with real-world use cases, including tipping and microtransactions. As more businesses and platforms accept DOGE, its value is likely to rise.
Celebrity Backing and Media Attention – Dogecoin’s rise in popularity has been fueled by media buzz and endorsements, particularly from figures like Elon Musk. This attention gives it a unique advantage in attracting new investors.
Low Entry Price – Dogecoin’s relatively low price compared to other major cryptocurrencies makes it an attractive option for newcomers, allowing a broader group of investors to get involved.
Conclusion:
Given its passionate community, growing recognition, and increasing use cases, Dogecoin has a strong potential to grow. I believe its value will rise as more people get behind it and as it continues to gain real-world utility.
Mvh Mert Arslan


DOGEUSD BUY ANALYSIS SMART MONEY CONCEPT Here on Dogeusd price form a demand around area of 0.19019 and is likely to go up as more buyers may come and push the price up so trader should go for long with expect profit target of 0.21218 and 0.23269 . Use money management

WE ARE STILL SOOOO EARLY IN THE CYCLE!!!I think we are still earlier in the cycle than most people realize. I think DOGE is here in the cycle. If this is correct, this BULL RUN will be bigger than anyone thinks!!!


DOGE update#DOGE made a huge descending wedge which is a bullish signal i think that if the market crosses the confirmation line its able to rise to the next supply zone

Bullish Trading Signal Overview for Dogecoin (DOGE)Dogecoin (DOGE) indicates a bullish trading signal. After a prolonged downtrend, we observe a significant reversal pattern with the latest green candle forming a strong bullish engulfing pattern. This pattern encapsulates the previous red candle entirely, suggesting a strong buying momentum and a potential shift in market sentiment from bearish to bullish.
Key Observations:
Support Level: The chart shows a recent bounce from a low of approximately $0.20914, which now acts as a critical support level. The rebound off this support suggests that the market is rejecting lower prices, adding credibility to the bullish momentum.
Current Price: The current price is marked at around $0.23907, showing a noticeable recovery from the support level.
Volume: Although not explicitly shown on the chart, the bullish candle's size suggests increased buying activity, which typically indicates rising interest and a potential continuation of the upward trend.
Stop-Loss: A stop-loss has been strategically placed just below the recent low at $0.20032, a prudent move to protect against any sudden reversal in the downtrend.
Profit Target: The profit target is set at $0.27152, located near a previous area of resistance. This target anticipates a reasonable upswing without reaching for the peak, making it a realistic and achievable goal.
Trading Strategy Recommendation
Considering the bullish engulfing pattern and the subsequent recovery, entering a long position at the current level or on a slight dip towards the support level seems promising. The stop-loss placement below the recent low limits potential losses, while the profit target provides a favorable risk/reward ratio.
Entry Point: Around the current price of $0.23907 or on minor pullbacks.
Exit Strategy: Aim for the profit target of $0.27152 while maintaining flexibility to adjust as the price action develops, particularly if the market sentiment continues to strengthen.
Conclusion
The technical setup for Dogecoin (DOGE) suggests a strong bullish potential in the short term. Traders should monitor volume and price action closely for further confirmation of continued bullish behavior. Always adhere to a disciplined trading plan with defined stop-loss and take-profit levels to manage risks effectively.

DOGEUSD Coin LongDOGEUSD is not net-long regression break.
It was a large move over night in the whole crypto world.
I am considering my options vs other CRYPTO pairs

DOGE: Is the bottom in?This weekend looks like the crypto God candle weekend for the majors. Doge is also looking strong, but chance of it being part of the US strategic reserve is slim to none. But, when tide is rising, it doesn't matter. Right now, the challenge in front of doge is to get out of the downward channel, and fast. The price action has two bullish scenarios left. Depending on how strong the momentum gets, one or the other should come to pass.
1. Ending diagonal (pink): The price action for both intermediate 1 and Minor 1 can be counted as 3 waves zigzag or five waves and be valid. This is something that EW sometimes cannot paint a clean picture until a lot of time passes. But as traders, we need to just figure out the next move and be prepared. In case doge is playing out an ending diagonal pattern, then we should see 3 waves moves to the upside. And since, it is an expanding diagonal, we should see wave 5 is larger than wave 3. So, as a normal range of 1 to 1.236 extension, price should top out between $1.1 to $1.6. The confirmation will be a sharp decline from the top.
2. Wave 3 of 3 of 5 (blue): probability of this should be greater with a strong momentum to the upside. We should see price rocket out of the channel and get to all time high before a meaningful pullback. Price should break through $1 milestone and go higher without stopping for a breather as we have seen in the previous rocket moves. Target will be $6-$10 and level of insanity will be at its peak!
How to trade between the two scenarios: The difference of targets between the two scenarios is massive. We don't want to take a risk of losing all the gains in matter of days, nor do we want to stay on the sidelines when price makes 6x gains in matter of weeks. So, to stay safe, it is important to take some profit between 1 - 1.236 fib extension (at least 25% - 30%) and put a stop loss at $0.48 for the rest. There could be other higher areas to put the stop loss to phase out with more gains, but $0.48, which is the top of minor wave 1, and breaking that will be the confirmation of the top. If price doesn't make it to that level and goes back up to make strong highs, then buy back in at the breakout (this would be one of the scenarios where we can buy a breakout) to jump back on the ship and ride the lightning.
Bear case: There is always the other side of the coin. If price fails to break above $0.28 and the channel, then chances are, the downtrend will continue. It can keep going down to find support at the trend lines. If the trend lines break, then chance of primary wave 4 still in play goes higher. Target can be anything till $0,018. Hope that is not the case...

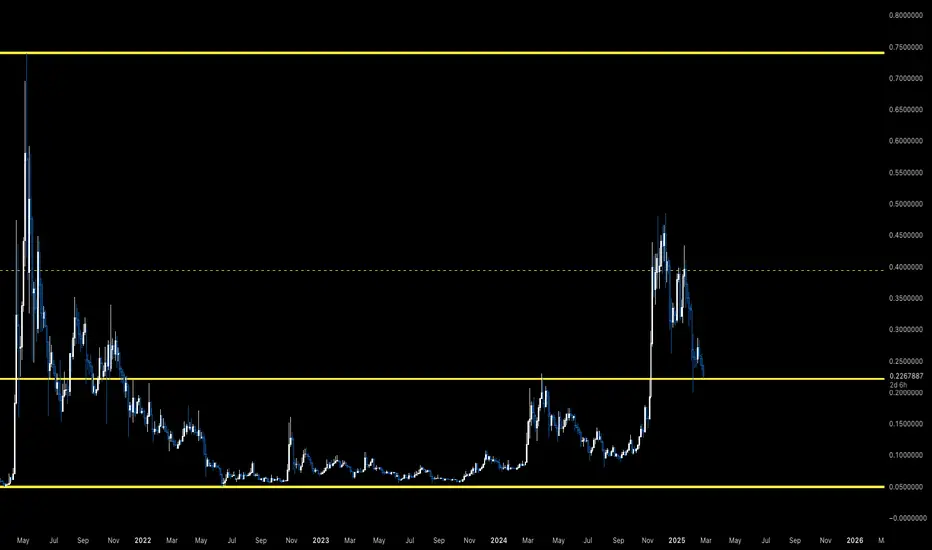
Dogecoin (DOGE), my notes for long-termThere are rising and falling wedges in the " flag formation ." The short-term target of this formation is 0.55 - 0.6. The flag formation target is 0.9 - 1 dollar goal.
Apart from this, there is a strong support between 0.2 - 0.22, if it is divided, the bullish formation will not work. The close resistances are 0.31 - 0.37 - 0.44 - 0.56 respectively. Apart from this, movements within the trend lines can be followed.
This is not investment advice.

DOGEUSD BUY ANALYSIS SMART MONEY CONCEPT Here on Dogeusd price form a demand around area of 0.2032 and is likely to continue go up as more buyers will likely to come and push the price up so trader should go for long with expect profit target of 0.2791 and 0.3573 . Use money money management

Conservative DOGEUSD bullish outlookPossible reversal if DOGE Breaking 0.31407.
First target 0.97 to 1.24 at least


Is it time to question why you bought? I've made a series of bearish posts on crypto over the last months and had my fair share of feedback on what people are doing and expecting.
A lot of you can't be doing too well right now. Perhaps it's time to take another think through why you are doing this and is you're ready for the worst case outcomes.
This isn't a gloating post. Many of my peers get really nasty when they make money in shorts. Personally, I know if I'd decided to build my business in something other than trading - I'd have worked hard and be bleeding out that money right now. I'd 100% be a bull from a laymen perspective. I'd be buying things I consider reckless now.
I want to offer some insights into why you may have done this so as to give you some counter balance in your thinking on the subject.
For one, if you're in crypto alts, pretty good chance you've not done a lot of real analysis. Right? You liked the community, or you had a friend who was in it, you saw a Youtube video ...
Basically what happened was BTC went up a lot. You wanted to make that money. And the game changed in such a way that you can not make big gains in BTC so you got into the alts.
Right?
I imagine that's the case for many.
If so, it's time to consider the quality of the info you've gotten.
Does it come from the cycles?
Mathematically the idea of cycles is entirely nonsense. Such a repeatable cycle is also nonsense from a markets perspective. And all through this "Cycle" you've literally watched it fail. It's nonsense. BTC got higher faster. It's about 10K drop away from the core thesis failing (in absolutist terms) and there was no alt season.
Everything is down 50% during the time the idea was mass pimped by content creators (NOT TRADERS ....).
Is it Saylor?
Saylor is following the same playbook he used during the tech bubble. During 2000 and 2001 the whole thing entirely failed. The debt was converted to shares. Everyone was diluted and then the stock crashed over 90%.
It really didn't go so well before.
And have you listened to Saylor? Like, seriously? Anytime I see him he's talking about market dynamics and linking it with laws of science. The guy is troll or insane.
"What if BTC stops going up".
"Hahaha well what if water stops flowing downhill? I think physics solved that one for us".
.....WHAT!
If it all drops, Saylor will be deemed to have insane. Rambling on in metaphors that made no sense.
Is it the internet?
Is it the people talking about that? All those people, they can't all be wrong ... right?
Have you taken a moment to consider the quality of these people's analysis? Its ...lacking.
Have you noticed how childish and rude they are all the time? How they can not engage in a civilised adult debate on a topic? Do you think the fact 70% of their communication is in emojis and insults gives them a strong knowledge base to tell you how to make important decisions?
Have you been led to believe the future is known?
I see this all the time. People who appear to be complete noobs speaking with complete confidence about the absolutely certain future based on completely no substance.
This one is a really short point. Ignore people foolish enough to trick themself into thinking they know the future!
===
I wish everyone well and hope my bear thesis is wrong.
But if I am right - the above will be the opinion of everyone once the mania has died.

Elliot Wave Theory Analysis on DOGENew to Technical Analysis here but I am loving my learning journey. Watch this absurdly long video to see my thoughts on where I think we are in relation to past cycles and how after deep thought on the Elliot Wave Patterns I have found it astonishingly lines up to a tee with past cycles. I didn't modify it anyway to make it line up ------ it just did!

Dogecoin (DOGE/USD) Scalping & Mid-Term Analysis🔥 Market Overview:
Trend: Bearish
Key Levels:
Resistance: $0.21, $0.22
Support: $0.20, $0.18
Indicators:
MACD: Weak bullish momentum, but still indecisive
RSI: 51.6, neutral zone, no strong signal
EMA 200: Strong resistance at $0.22
Liquidity & Volume:
Decreasing volume, market lacks strong momentum
Possible accumulation phase before a major move
🔥 Scalping Strategy:
🩸 1. Momentum Scalping (Short Bias)
Entry: Short at $0.21-$0.212
Target: $0.20 (-4.7%), $0.18 (-14.2%)
Stop-loss: Above $0.215
Expected Profit: 4.7%-14.2%
🩸 2. Range Scalping
Buy Zone: $0.20-$0.195
Target: $0.21 (+5.1%)
Stop-loss: Below $0.19
Expected Profit: 5.1%
🩸 3. Breakout Scalping
Entry: If DOGE breaks below $0.195
Target: $0.18 (-7.7%)
Stop-loss: Above $0.20
Expected Profit: 7.7%
🔥 Mid-Term Trend Forecast (1-3 Weeks):
If DOGE fails to reclaim $0.21, further decline to $0.18 is likely
If DOGE breaks above $0.21, expect a retest of $0.22
Only a breakout above $0.22 will flip the trend bullish
🔥 News & Market Context:
DOGE recently broke below key support, indicating weakness
Lack of strong buying pressure
Market sentiment remains indecisive
🔥 Decision & Risk Rating (1-10):
🩸 Short-term (Scalping): Short bias, 7/10 (Profitable but needs confirmation)
🩸 Mid-term (Swing): Bearish, 6/10 (Still weak, potential downside)
🩸 Best Play: Short near $0.21 with a target of $0.20-$0.18
👑 Final Verdict:
Dogecoin remains weak, with no strong momentum. Short setups are preferable. If $0.21 holds as resistance, expect further downside.
🔥 FinCaesar's Statement:
"A trader without discipline is a gambler without luck."

DOGEDeviates below channel bottom to take February 3rd lows. Importantly, unable to break down lower today at intraweek lows. If can get back inside channel bottom, around same area as election day highs, I imagine that the mother of all short squeezes will ensue. Slowly, then all at once.

DOGE The Next To Die In This Flush Of Crap Down The ToiletDoge had an amazing run, those who made money and got out I applaud you. Those still holding these bags of coal are about to get wrecked. Memes are dying, no one cares about them anymore. People are beginning to realize that these things have ZERO utility and no future. No ETF will ever get approved, its too inflationary. Take a look at the Grayscale trust thats a great insight to how many institutional investors want this thing. Its Total assets under management are less than $2 million dollars. Thats laughable compared to their other holdings. So even in the slim chance this turd gets an ETF it'll be an epic failure.
Your messiah Elon has abandoned this thing, the onyl real hope you all had for real world utility. Litecoin miners are dumping this as soon as they get it. The meme coin frenzy has died down. In January alone this year there were 600,000 meme coins created thats an all time record for a single month. That meme bubble is about to collapse as people move toward more utility driven cryptos and this space gets wrangled in a bit. Many people including myself have made a bunch of money playing in the meme coin casino, it was fun when it first started. 100x's everywhere. Now its pretty much over. The future for Doge is a slow and steady decline back to NAV under a penny. It was a great pump and dump. Dont marry your investments especially ones that are just memes with no utility they are made to get in and out, make money and rotate into something of value to preserve your wealth.
None of this is financial advice, just my opinion.

Dogecoin (DOGE/USD) – Scalping & Mid-Term Analysis🔥 Market Overview:
Trend: Strong Bearish
Resistance Levels: $0.213 – $0.230 (EMA 200)
Support Levels: $0.195 – $0.190
Volume & Liquidity: Heavy sell pressure, weak bullish response
Indicators:
MACD: Weak bullish crossover, but low momentum
RSI: 40, oversold but no strong bounce
EMA 9 & 200: Bearish trend intact, no clear reversal
Market Maker Moves: Possible stop hunts near $0.195
🔥 Scalping Strategy:
🩸 1. Buy near: $0.195 – $0.197
Target 1: $0.202 (+3.6%)
Target 2: $0.205 (+5.13%)
Stop-Loss: Below $0.193
🩸 2. Short near: $0.205 – $0.208
Target 1: $0.200 (-2.43%)
Target 2: $0.195 (-4.88%)
Stop-Loss: Above $0.210
🔥 Mid-Term Trend Forecast (1-3 Weeks):
Bearish Continuation: Below $0.195, DOGE could test $0.185
Bullish Reversal: A strong close above $0.213 could push DOGE to $0.230
⚡ News & Market Context:
DOGE dropped 22% in a week, breaking key support levels
Meme coin sector under pressure, lowering speculative demand
Exchange Order Book: Resistance near $0.205, heavy sell walls
💰 Profit Calculation & ROI:
Long:
Profit: +5.13%
ROI: +25.64%
Short:
Profit: +4.88%
ROI: +24.39%
👑 Trade Rating (1-10):
Long Setup: 6/10 (Good entry at $0.195, but risky)
Short Setup: 8/10 (Better risk-reward, stronger trend)
🔥 Decision:
🩸 Short-term: Scalp long from $0.195 cautiously
🩸 Mid-term: Favor shorts unless DOGE reclaims $0.213
🩸 Ideal Play: Short from $0.205, targeting $0.195
🔥 Best Asset for Scalping: DOGE offers volatility, but BTC remains more stable
👑 Final Verdict: Scalp cautiously, shorts preferred!
🔥 FinCaesar:
"Trade the trend, or be crushed by it."

DOGE/USD – 30-Min Long Trade Setup!📌 🚀
🔹 Asset: Dogecoin (DOGE/USD)
🔹 Timeframe: 30-Min Chart
🔹 Setup Type: Descending Triangle Breakout
📌 Trade Plan (Long Position)
✅ Entry Zone: Above $0.2121 (Breakout Confirmation)
✅ Stop-Loss (SL): Below $0.2041 (Break of Support & Triangle)
🎯 Take Profit Targets
📌 TP1: $0.2212 (First Resistance Level)
📌 TP2: $0.2328 - $0.2350 (Final Target – Extended Bullish Move)
📊 Risk-Reward Ratio Calculation
📈 Risk (SL Distance): $0.2121 - $0.2041 = $0.008 risk per DOGE
📈 Reward to TP1: $0.2212 - $0.2121 = $0.0091 (1:1.14 R/R)
📈 Reward to TP2: $0.2328 - $0.2121 = $0.0207 (1:2.59 R/R)
🔍 Technical Analysis & Strategy
📌 Descending Triangle Breakout: DOGE has been in a downtrend, with signs of a breakout near $0.2121, indicating potential bullish momentum.
📌 Trendline & Support Bounce: The price is testing the descending trendline breakout, with a strong possibility of reversal.
📌 Breakout Confirmation: A strong bullish candle closing above $0.2121 with volume increase will confirm the move.
📌 Momentum Shift Expected: If price holds above $0.2121, a rally toward $0.2212 (TP1) and $0.2328+ (TP2) is likely.
📊 Key Support & Resistance Levels
🟢 $0.2041 – Strong Support / Stop-Loss Level
🟡 $0.2121 – Entry / Breakout Level
🔴 $0.2212 – First Resistance / TP1
🟢 $0.2328 - $0.2350 – Final Target / TP2
🚀 Trade Execution & Risk Management
📊 Volume Confirmation: Ensure strong buying volume above $0.2121 before entering.
📈 Trailing Stop Strategy: Move SL to entry ($0.2121) after TP1 ($0.2212) is hit.
💰 Partial Profit Booking Strategy:
✔ Take 50% profits at $0.2212, let the rest run to $0.2328 - $0.2350.
✔ Adjust Stop-Loss to Break-even ($0.2121) after TP1 is reached.
⚠️ Fake Breakout Risk
❌ If price fails to hold above $0.2121, it could indicate a false breakout—exit early.
❌ Wait for a strong candle close above $0.2121 for confirmation before entering aggressively.
🚀 Final Thoughts
✔ Bullish Setup – Holding above $0.2121 could lead to higher targets.
✔ Momentum Shift Possible – Watch for volume confirmation.
✔ Favorable Risk-Reward Ratio – 1:1.14 to TP1, 1:2.59 to TP2.
💡 Stick to the plan, manage risk, and trade smart! 🚀🏆
🔗 #CryptoTrading #DOGE #Dogecoin #BreakoutTrade #TechnicalAnalysis #MarketTrends #ProfittoPath #DayTrading #MomentumCrypto #SwingTrading #TradingView #LongTrade #TradeSmart #RiskManagement #CryptoBreakout #Investing #CryptoAlerts #ChartAnalysis 🚀📈

DOGE - THE big PictureHello!
I have a treat for y'all... I decided to start over with a clean sheet to illustrate our single most influential position and its projection.
see the chart for full observations.
these patterns are in 3D and propagate through space like flying monsters. they behave quite predictably similar on every time frame... so the long time frame here... the 2 week candle, should be not different.
We have not seen any sort of a major reversal yet. ie, a head and shoulders, or double or triple top, heavy cloud cover, etc. I believe that the two recent peaks are far enough apart (not even) to be part of a large pennant style continuation pattern, and not a double top.
at every position, there are 4 influences battling. each one the unique shape of a flying monster. these represent the bearish bears, bullish bears, bullish bulls, and bearish bulls. this also happen on every time frame. Eliot wave theory describes this well, and the Hartley patterns try to identify these monsters by their ratios. quite clever!
I believe that DOGE coin is the only coin that invokes the emotion of love. unconditional love. this is also the journey we are all on of ascension.. and the phase shift where the 3D earth peerages from the 5D earth is governed by ... LVOE. so LOVE is the future. Healing our wounds and ascending to that highest vibration... so that we make the cut to the new earth built on love and respect... not fears and greed.
oooh... that sort of sounds like Bitcoin. fear and greed! yikes!
Dogs are mans best friend... loyal... run in packs... jus like us... we are suppose to be in tribes. thats why we all feel so alone even when we are with someone....
so... that said, let me welcome you to the DOGE tribe. one built on love, where we all store our hard earned energy credits as a bank for each other... only to be withdrawn when need. to be used only for good... to help each other, and humanity... as we shift to a contribution based economy, instead of an extractive one.
Sending Love!
Go Doge Go!
psssss: (see my Doge vs Btc post linked below... and follow along!