DemandThis asset is currently in a downtrend, making LHs and LLs, price seems to be retreating from the .2313 area. Price may be retreating to one of key layers below. Please see chart for price action.
DOGEUSD.P trade ideas

Weekly trading plan for DOGEIn this idea I marked the important levels for this week and considered a few scenarios of price performance
The nearest support is at $0.2186, if it is broken, the price may break the trend line
Write a comment with your coins & hit the like button and I will make an analysis for you
The author's opinion may differ from yours,
Consider your risks.
Wish you successful trades ! mura

Possible entry into the pullbackWaiting for testing on the green line and selling at a profit on the red line. this if there is no bullish trend
DOGEUSD Critical Supply Zone – Dump Incoming or Just a Fakeout?Dogecoin just rejected hard from a strong Supply Zone around $0.2400, showing a sharp intraday drop of over 8%. Is this the beginning of a deeper correction or just a healthy retrace?
Key Levels to Watch (1H Chart):
1. Resistance Zone (Supply):
$0.2400 - $0.2450: Heavy supply zone marked by LuxAlgo’s visible range. Price got sharply rejected here, indicating strong seller interest.
Expect any move into this zone to face significant resistance unless supported by volume surge.
2. Immediate Support:
$0.2027: First key demand level. A breakdown here could trigger panic selling.
Watch this level for potential bounce or breakdown setup.
3. Major Support Zone:
$0.1564 - $0.1620: High volume node + previous accumulation range.
This is where large buyers previously stepped in. If DOGE dumps hard, this is a potential long entry zone.
4. Bearish Signal:
Price created a double wick rejection at the top of the supply zone.
Red arrows suggest a potential drop to $0.2027, or even $0.1564, if volume confirms.
Potential Trade Setup:
Short Bias: If price fails to reclaim $0.2400 zone and breaks below $0.2250.
TP1: $0.2027
TP2: $0.1564
SL: Above $0.2450
Risk/Reward: High with tight stops above clear supply
Fundamental Watch:
Multiple U.S. economic events approaching (CPI, PPI). Volatility could spike around May 13–16. Combine TA with news timing!
---
Let’s discuss:
Are you shorting DOGE or buying the dip? Drop your analysis and let's trade smarter together!
#DOGE #Dogecoin #Crypto #Altcoins #LuxAlgo #TechnicalAnalysis #SupplyDemand #CryptoTrading

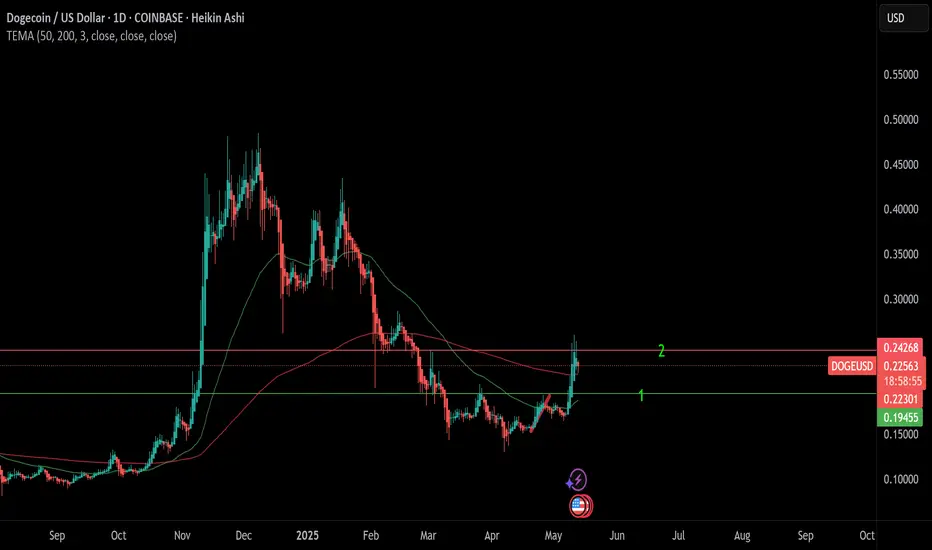
DOGE - Round 1 Almost Tapped!Good Morning,
hope all is well. As you can see here, we have had a great bull run which was initiated April 5th. Last week we saw a great break out from the last price structure however a quick rejection into the weekend. I am still anticipating one more run up before we consolidate again as this rejection shows some weakness in the current buying power of DOGE.
Enjoy!

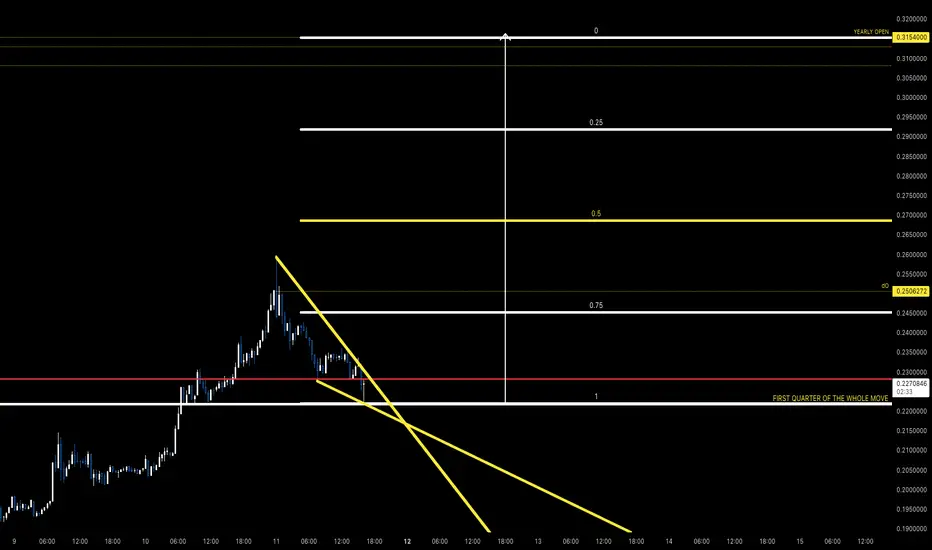
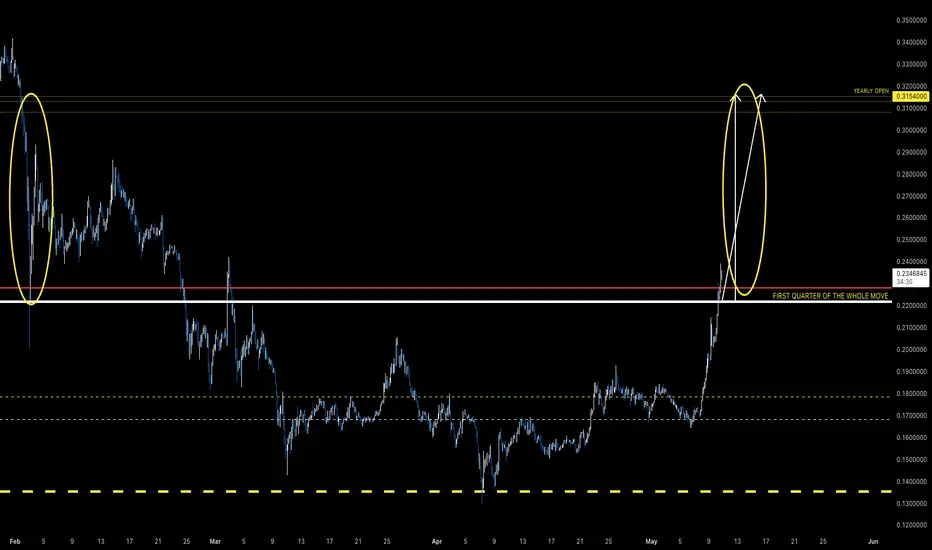
DOGEIF not in position this retest of first quarter of the whole move presents opportunity. Weekly close later today above and we're set up nicely for a run on Yearly Open at .31
Dance of the EMAsOn the 2 HR chart, the crypto asset consolidates on top of the 21 EMA, price needs to overcome .23476 price to continue the march. The 21 EMA sits over the 50 EMA which sits over the 200 EMA. If we get bearish action keep an eye on those levels, be safe and have a nice day.


DOGEDOGE is starting to bark again... coming back up as quickly as it came down. Yearly open next target.
Possible Bullish Parallel ChannelHere we have DOGE moving in an upward channel, indicators are saying asset is overbought, price has cycled to the top of the channel and could possibly breakout to the .24 cent range but a pull back to middle of the channel is possible (.21) range or to the bottom of the channel closest demand (.20) range. Have a nice day be careful.

DOGE to new ATHDOGE has been sleeping since the ATH in 2024. But has now woken up. The interest in this coin of freedom between people has again started to spike. On 21D chart there's a giant Cup & Holder with the promise of taken this coin to a minimum of $0.72 !

Cup & Holder on Doge DOGE has been sleeping since the ATH in 2024. But has now woken up. The interest in this coin of freedom between people has again started to spike. On 21D chart there's a giant Cup & Holder with the promise of taken this coin to $0.72.

DOGE looking really good🚀 DOGE is looking technically strong heading into the next potential explosive cycle. As always, crypto carries risk — the real question is: how much are you willing to lose? 🧠💸
Remember: only invest what you can afford to lose. Stay smart, stay strategic. #Dogecoin #Crypto #InvestWisely

DOGEUSD Started its final rally and can hit $1.300Dogecoin (DOGEUSD) just broke above its 1W MA50 (blue trend-line) again for the first time since March 24 2025 and is doing so after a clear rebound on its 1W MA100 (green trend-line). This is a technical bottom formation, that resembles the one on September 11 2017, right before that Cycle's final rally was initiated.
The 1W RSI has already broken above its MA trend-line (yellow) and every time that took place since October 16 2023, DOGE posted a strong rally. As you can see, the similarities between the two fractals are remarkable, both unfolding a structured bullish pattern on similar stages, with a 1W MA50/100 Bullish Cross leading to the massive Bull Flag (green) that bottomed on the 1W MA100 and initiating the parabolic rally.
In 2017 it topped on the 1.786 Fibonacci extension, so if it continues to replicate that fractal, we expect this run to hit $1.300 by the end of the year and make the Cycle's Top.
-------------------------------------------------------------------------------
** Please LIKE 👍, FOLLOW ✅, SHARE 🙌 and COMMENT ✍ if you enjoy this idea! Also share your ideas and charts in the comments section below! This is best way to keep it relevant, support us, keep the content here free and allow the idea to reach as many people as possible. **
-------------------------------------------------------------------------------
💸💸💸💸💸💸
👇 👇 👇 👇 👇 👇

DODGE LongDodge is now net long on the regression break.
I am considering all my options in the CRYPTO world.

buying??!@Dogecoin temporary buy strong corrective zone after that strong possibility of continued downward trend unless confirmed to break the general downward trend and bullish trend

DOGE Explodes +7% – Major Supply Zone Hit! Will the Rally Hold?”Dogecoin (DOGE/USD 1H) – Sharp Rally into Supply Zone!
DOGE just printed a massive +6.84% breakout, surging straight into a key supply zone between 0.1835 and 0.1900, as identified by LuxAlgo's Supply & Demand.
What’s happening:
Clean break above previous resistance at 0.1700
Entering high-volume node (0.1835–0.1900), where sellers previously dominated
RSI likely overheating on lower TFs, signaling potential short-term exhaustion
Key Zones to Watch:
Resistance: 0.18465–0.1900 (major supply = likely rejection or breakout trap)
Support: 0.1700 (former resistance now flipped support)
Demand Base: 0.1557–0.1500 (ideal long reload zone if price dips)
Scenarios:
Bullish Breakout: Clear move and close above 0.1900 = fresh rally potential toward 0.21+
Rejection Play: If supply holds, expect pullback to 0.1700 or deeper into demand zone (0.1550 area)
How I'm trading it:
Watching PA at 0.1850–0.1900 closely
Entering shorts if rejection candle confirms
Long reload only at 0.1700 or 0.1550 if structure remains bullish
DOGE moves fast — are you long or waiting for a pullback?
#Dogecoin #Crypto #DOGEUSD #Breakout #LuxAlgo #SupplyAndDemand #TradingView #CryptoTrading #Altcoins

DOGE/USDT: Descending Triangle Breakout with Bullish PotentialA weekly chart of DOGE/USDT on Binance, spanning from 2017 to early 2025 shows a clear descending triangle pattern that has formed over several years, characterized by a flat support base around $0.0030-$0.0040 (2017-2020) and a downward-sloping resistance trendline connecting lower highs over time. The price has recently broken out of this pattern and is showing signs of bullish momentum.
Descending Triangle Pattern:
- A descending triangle is typically a continuation pattern, but in this case, it acted as a reversal pattern after a prolonged downtrend. The flat base of the triangle (around $0.0030-$0.0040) served as strong support, with the price bouncing off this level multiple times between 2017 and 2020.
- The upper trendline of the triangle, which slopes downward, connected key lower highs at approximately $0.069 (2018), $0.018 (2019), and $0.010 (2020). This trendline was tested multiple times, showing consistent selling pressure at these levels.
- In early 2021, the price broke above this trendline with a strong bullish candle, accompanied by a significant spike in volume (visible at the bottom of the chart). This breakout confirmed the end of the consolidation phase and the start of a new uptrend.
Post-Breakout Price Action:
- After the breakout, DOGE/USDT surged dramatically, reaching a high of $0.737 in 2021, driven by market hype and increased adoption. However, the price then entered a corrective phase, pulling back to retest the breakout level around $0.169 in 2023. This retest is a common occurrence after a breakout, as it confirms the previous resistance as new support.
- The price has since consolidated in a range between $0.130 and $0.237, forming a rectangular consolidation zone (highlighted in yellow on the chart). This range indicates indecision in the market, with buyers and sellers battling for control.
- Recently, the price has approached the upper boundary of this range at $0.237, and the current candle (as of early 2025) shows a push towards this resistance. A breakout above this level would signal the continuation of the bullish trend.
Key Levels to Watch:
- Support Zone ($0.130-$0.150): This area has acted as a strong support during the consolidation phase. If the price fails to break above $0.237, it may pull back to this zone for another retest. A break below $0.130 would invalidate the bullish setup and could lead to a deeper correction towards $0.069.
- Resistance Zone ($0.237): This is the immediate hurdle for DOGE/USDT. A confirmed break above this level, especially with strong volume, would confirm the continuation of the uptrend.
- Next Resistance ($0.400-$0.450): The measured move of the descending triangle can be calculated by taking the height of the triangle (from the base at $0.003 to the highest point at $0.069, roughly $0.066) and adding it to the breakout point (around $0.169). This gives a target range of $0.235-$0.400. However, considering the momentum and historical price action, the price could extend towards $0.450 if bullish sentiment persists.
Volume Analysis:
- Volume spiked significantly during the breakout in 2021, confirming the strength of the move. However, during the consolidation phase (2023-2025), volume has been relatively low, indicating a lack of strong directional momentum.
- For the breakout above $0.237 to be valid, we would ideally want to see an increase in volume, signaling renewed buying interest. Without this, the breakout could be a false move, leading to a rejection and pullback.
Market Context and Risks:
- DOGE/USDT is known for its volatility, often driven by market sentiment, social media hype, and news events. While the technical setup looks bullish, external factors could impact the price. For example, a broader market downturn or negative news could lead to a rejection at $0.237.
- The weekly timeframe suggests a long-term perspective, so traders should be prepared for potential short-term volatility. Using a stop loss below $0.169 helps manage risk in case the setup fails.

DOGEUSD: Building a Base Before the Next Bull Run?Dogecoin is currently consolidating near a critical demand zone (0.13996 – 0.16825) — a level that previously sparked strong bullish reactions. With U.S. macro news on the horizon (FOMC, Jobs Data), this zone could be the launchpad for the next leg up.
Key Technical Levels:
Major Demand Zone: 0.13996 – 0.16825 (orange block) – buyers consistently defend this area
First Bullish Target: 0.30279 – mid-range supply zone
Ultimate Target: 0.43436 – high-volume node and multi-month resistance
Why This Matters: This tight range could be a classic accumulation phase before a breakout. The repeated defense of this zone, plus increasing wicks on the downside, suggest smart money may be loading up.
Bullish Scenario: If DOGE can hold above 0.168 and break out of this demand area with volume, a rally toward 0.30+ becomes highly likely. A close above that could trigger momentum-based buying and FOMO-driven moves into the 0.43 range.
Watch for:
Bullish reversal patterns (e.g. double bottom, engulfing candle)
Volume spikes confirming breakout from the base
Reaction to upcoming USD news events
Let’s Discuss: Are the whales quietly buying DOGE again? Is a meme coin rally brewing?
Drop your thoughts and follow for more setups! #Dogecoin #DOGE #CryptoAnalysis #Altcoins #TradingView #LuxAlgo #PriceAction #CryptoSetup #BreakoutTrade #SupportAndResistance

Weekly trading plan for DOGEIn this idea I marked the important levels for this week and considered a few scenarios of price performance
The price is already under the Pivot points closer to the local bottom, so when the local bottom is broken, the further decline to the support areas is expected
Write a comment with your coins & hit the like button and I will make an analysis for you
The author's opinion may differ from yours,
Consider your risks.
Wish you successful trades! MURA

Doge H4 | Overlap support at 38.2% Fibonacci retracementDoge (DOGE/USD) is falling towards an overlap support and could potentially bounce off this level to climb higher.
Buy entry is at 0.1667 which is an overlap support that aligns close to the 38.2% Fibonacci retracement.
Stop loss is at 0.1460 which is a level that lies underneath an overlap support and the 61.8% Fibonacci retracement.
Take profit is at 0.2028 which is a swing-high resistance.
High Risk Investment Warning
Trading Forex/CFDs on margin carries a high level of risk and may not be suitable for all investors. Leverage can work against you.
Stratos Markets Limited (tradu.com):
CFDs are complex instruments and come with a high risk of losing money rapidly due to leverage. 63% of retail investor accounts lose money when trading CFDs with this provider. You should consider whether you understand how CFDs work and whether you can afford to take the high risk of losing your money.
Stratos Europe Ltd (tradu.com):
CFDs are complex instruments and come with a high risk of losing money rapidly due to leverage. 63% of retail investor accounts lose money when trading CFDs with this provider. You should consider whether you understand how CFDs work and whether you can afford to take the high risk of losing your money.
Stratos Global LLC (tradu.com):
Losses can exceed deposits.
Please be advised that the information presented on TradingView is provided to Tradu (‘Company’, ‘we’) by a third-party provider (‘TFA Global Pte Ltd’). Please be reminded that you are solely responsible for the trading decisions on your account. There is a very high degree of risk involved in trading. Any information and/or content is intended entirely for research, educational and informational purposes only and does not constitute investment or consultation advice or investment strategy. The information is not tailored to the investment needs of any specific person and therefore does not involve a consideration of any of the investment objectives, financial situation or needs of any viewer that may receive it. Kindly also note that past performance is not a reliable indicator of future results. Actual results may differ materially from those anticipated in forward-looking or past performance statements. We assume no liability as to the accuracy or completeness of any of the information and/or content provided herein and the Company cannot be held responsible for any omission, mistake nor for any loss or damage including without limitation to any loss of profit which may arise from reliance on any information supplied by TFA Global Pte Ltd.
The speaker(s) is neither an employee, agent nor representative of Tradu and is therefore acting independently. The opinions given are their own, constitute general market commentary, and do not constitute the opinion or advice of Tradu or any form of personal or investment advice. Tradu neither endorses nor guarantees offerings of third-party speakers, nor is Tradu responsible for the content, veracity or opinions of third-party speakers, presenters or participants.

DOGECOIN -Rejection From Key Supply Zone |Bears Gaining Control?Dogecoin is facing heavy resistance near the $0.1835 supply zone, where multiple rejections suggest buyer exhaustion. This level is also aligned with the LuxAlgo Supply and Demand Visible Range, adding more confluence to the bearish bias.
Key Observations:
Strong rejection from $0.1835 - $0.1800 supply zone.
Bearish momentum building below resistance.
Price forming a potential double top structure with lower highs.
Targets if Breakdown Confirms:
$0.1606 – Mid-range support and recent consolidation level.
$0.1399 – Major demand zone and high-volume area.
Breakdown below $0.1606 could trigger a sharper selloff into the orange demand zone.
Watch for:
Breakdown candle below $0.175 + retest = entry signal.
Bearish continuation pattern confirmation.
News catalysts (highlighted on chart for May 5–9) could add volatility.
Trade Idea:
Short bias below $0.175 with targets at $0.160 and $0.140.
Invalidation: Clean break above $0.1835 with strong bullish candle.
What’s your bias on DOGE? Drop a comment below – Long or Short?
---
#Dogecoin #DOGEUSD #CryptoTrading #SupplyAndDemand #LuxAlgo #Altcoins #BearishRejection #PriceAction #TradingView

