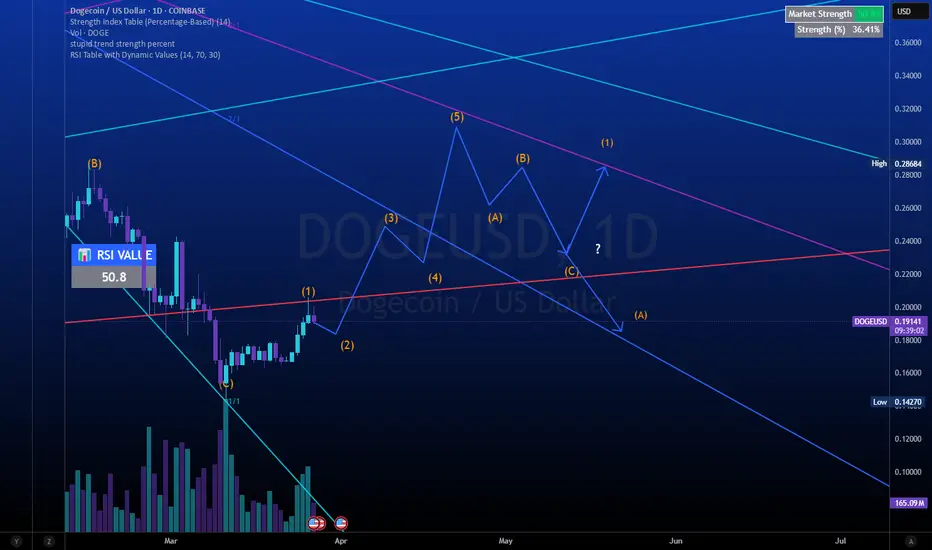
Day three doge price prediction date:3/30/2025not much to say besides it looks like it went up and down so i am thinking this could be a head and shoulders pattern or could be the start of another triple combo elliott wave
DOGEUSD.P trade ideas

Dogecoin to go up after meeting supportDogecoin has already shown a huge reaction to this trend line and is in line to reverse into a possible uptrend.

daily doge update day 2 Date:3/27/2025it is stile in the act of wave two and could have a final outcome of 28 cents
daliy prediction update date:3/27/2025in the update dogecoin has completed the second wave in the elliott wave theory and its next target is around 22-21 cents and i have found a new possible outcome on wave four it is not for sure though

DOGE - Spring is for running your dog!Hello.
Yellow trace is new for the recent wing up.
We could be looking for a more substantial reversal… like the DOuble bottom it forms.
Very exciting!
Have a great run!

@DOGEUSDT 20-25$ by end of Q3 2025?It can be, if it follows the pattern in ascending channel, pullback done! will wait and see :) @dogeusd_long @DOGEUSDT

daily doge coin prediction 1 day chart date:3/26/2025in this i used the elliott wave theory and the gann fan to predict where i think the price in doge will go. i also do one of these every day so make sure to check them every day :)

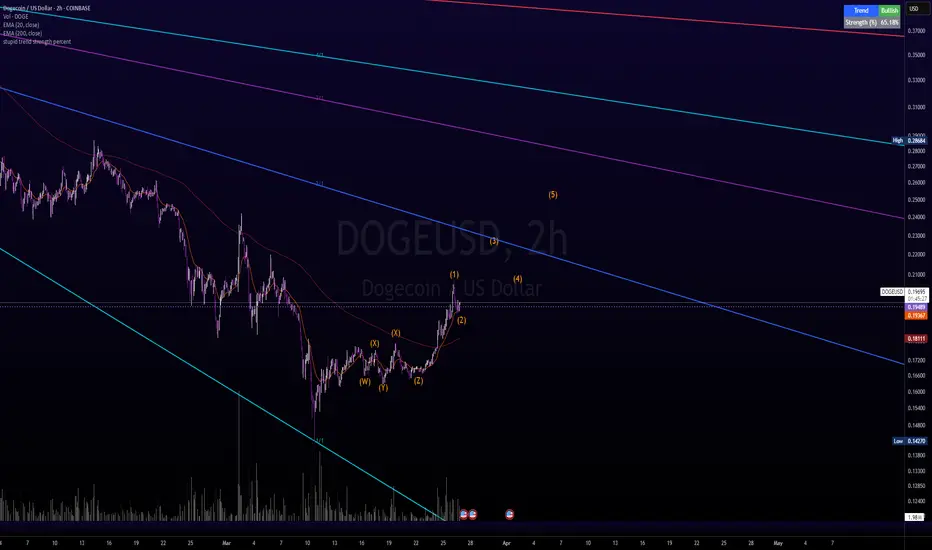
daily doge price prediction 2hr chart date:3/26/2025to find this outcome i have used the elliott wave and the gann fan to predict where doge coin could possibly go in the near future
DOGEUSD: This is the rally that will deliver $1.00Doge is neutral on its 1D technical outlook (RSI = 52.126, MACD = -0.009, ADX = 40.011), recovering from its prior oversold state and testing the 1W MA50 for the first time in 3 weeks. The current rebound is being made after touching the 1W MA200, which is technically the new long term bottom, similar with August 5th 2024 and October 9th 2023. As shown, this is a once in a year buy opportunity that aims for the 1.618 Fibonacci extension on the HH trendline. The trade is long, TP = 1.000.
## If you like our free content follow our profile to get more daily ideas. ##
## Comments and likes are greatly appreciated. ##

DOGEUSDBINANCE:DOGEUSD
☕ Cup and Handle Pattern in Play! 🚀
The chart is forming a classic cup and handle pattern, a bullish continuation setup that indicates potential for a strong breakout. Price has been rounding out the base, finding support at key moving averages, and could soon complete the handle formation.
🔍 Key Observations:
✅ Strong accumulation phase
✅ Price holding above key EMAs
✅ Potential breakout confirmation ahead
If the pattern plays out, we could see a significant upward move. What’s your take on this setup?

Plan DOGE - spring sessionRight now, is probably a good moment to open short positions.
The price reached the level I was pointing to, just perfectly!
It's incredible how accurately rules, norms and relationships are working. I am amazed every time when see in action the power of the principle.
Hope you were in time to open short positions. My base scenario - I am anticipating Dogecoin at 0.118 - 0.085 USD now and well bounce after this. Be careful, we will have the reverse confirmations upon usdt.d consolidates above 5.20%.
Consolidation below 5% will indicate a massive uptrend continuation.
PS: one more important observation is - I had my doubts whether price could go out of trend, within 2 & 4 waves. Within this formation we see a strong test, but not a break (as of now). This shows that a simple forecasting tools are one of the most reliable.

DOGEUSD making a huge bullish break-out. Eyes 0.800.Dogecoin (DOGEUSD) broke today above the Lower Highs trend-line that started 2 months ago (on the January 18 High).
The natural Resistance remains of course technically the 1D MA50 (blue trend-line) but with the 1D RSI already trending upwards and the price rebounding from the recent low at the bottom of the 1-year Channel Up, we can already claim that the new Bullish Leg has already started.
If it makes just a simple repeat of the previous Bullish Leg (which during Bull Cycles every rally is generally more aggressive than the previous), it can top the Channel Up and make a Higher High at $0.800.
-------------------------------------------------------------------------------
** Please LIKE 👍, FOLLOW ✅, SHARE 🙌 and COMMENT ✍ if you enjoy this idea! Also share your ideas and charts in the comments section below! This is best way to keep it relevant, support us, keep the content here free and allow the idea to reach as many people as possible. **
-------------------------------------------------------------------------------
💸💸💸💸💸💸
👇 👇 👇 👇 👇 👇

Doge is not what you think2017: XRP is winner, not doge
2021: DOGE is winner, not XRP
2025: SHIB is believed winner, not DOGE.
the pattern doesnt break.

Analysis of DOGE/USDT Chart (4H timeframe) – March 24, 20251. Key Technical Signals:
Ichimoku Cloud: Price has just broken above the Ichimoku Cloud after a long consolidation phase, giving an initial bullish signal. However, the future Kumo cloud has yet to expand strongly.
RSI (14): The RSI is currently around 66.98, approaching the overbought zone (70), suggesting strong bullish momentum but also warning of a possible short-term pullback.
MACD: The MACD line has crossed above the signal line, confirming bullish momentum. The histogram has turned green, supporting the upward move.
2. Elliott Wave Scenario (shown on chart):
The chart is projecting a 5-wave impulsive Elliott Wave pattern with the following target levels:
Wave 1: around 0.32319 USD
Wave 2 (correction): around 0.28997 USD
Wave 3: targeting 0.37091 USD
Wave 4: slight correction expected
Wave 5: final target around 0.43 USD
3. Key Resistance Levels:
0.323 USD: strong resistance and Wave 1 target.
0.37 USD: next major resistance and Wave 3 target.
0.43 USD: projected Wave 5 top.
4. Volume:
Volume is gradually increasing in recent sessions, indicating that buying pressure is returning to DOGE.
Trend Outlook:
Short-term trend (1-2 weeks): Bullish - likely breakout towards 0.323 - 0.37 USD following the Wave 1 and Wave 3 targets.
Medium-term trend: If price holds above the 0.29 USD support after Wave 2 correction, the medium-term outlook remains bullish with a target of 0.43 USD.
Caution: RSI approaching overbought may result in a minor pullback near 0.323 USD before further continuation.
Recommendation:
Consider entering long positions if price breaks and closes above 0.18-0.19 USD resistance zone and clears the Ichimoku Cloud.
Take partial profits near 0.323 USD (Wave 1) and look for re-entry opportunities on the Wave 2 pullback.
Suggested stop loss: below 0.17 USD (recent consolidation low).

$DOGE - Bear Trap BuyReposting my analysis from 3/8 as it was delisted b/c I referenced a non-TV external account. Also, a disclaimer since I've quickly discovered that people like to chirp and demean ideas on TV:
This is an IDEA. I maintain bull and bear cases for every underlying I analyze. My opinion about an underlying can change exceedingly quickly based on price action and how price's evolution either confirms or violates TREND (I define trend scholastically, NOT inferentially). I also may have 1 directional opinion about a security's higher timeframe and an opposing directional stance about a lower TF. Markets are fractal. Any serious trader/analyst understands what I'm articulating. This business is NOT about predicting. It is about understanding participant psychology, order flow, statistical distribution, risk vs. reward, profit margin, and probabilities.
With that said, here's my post from 3/8:
This is a technical (supply/demand) setup and is not a fundamental endorsement for CRYPTOCAP:DOGE ownership. $DOGE/USD (and crypto more broadly) has declined markedly (~60%) from December '24 highs. Late last month, low-quality daily demand (0.2021-0.1853) produced a minor bounce. DOGE quickly found sellers in advance of the opposing 1D supply zone (0.2428-0.2615), though, and was rejected. DOGE/USD appears poised for further near-term downside, with the weekly RSI threatening the 40 level.
If DOGE/USD presses lower and trades < 0.1813, the next pocket of daily demand = 0.1700-0.1419. More significantly, DOGE has a well-formed weekly buy zone @ 0.1513-0.1280. DOGE/USD's intermediate-term uptrend is controlled by 0.0805 (low of the corrective segment 3/25/24 - 8/5/24). Trend-continuation buying is valid within the bounds of the corrective segment, which DOGE traded into in early Feb. Buys are supported by 78.6% and 88.6% Fibonacci retracement levels and, to a lesser degree, Anchored VWAP + 1W Bollinger Band lower bound (not pictured).
Given crypto's broader price action and bearish momentum, confirmation entries are recommended. Potential buyers, depending on risk tolerance, should reference intraday timeframes for trend reversal signals vs. "catching a falling knife". Should DOGE bottom, preliminary target (T1) would be in advance of weekly supply @ 0.2398-0.2874 (use LTFs to refine and ID smaller sell zones that could challenge a rally). Trading > 0.2874 sets the stage for higher prices, with T2 supply 0.3288-0.3648. If DOGE/crypto approach T2 prices with significant bullish momentum (reference RSI), we could see subsequent prints in excess of December's 0.4846 high.
As always, feedback's welcome. Godspeed!
JHart

Wait for DOGE to come to YOU!!!One more pullback awaits those
that are patient. Looks like ETH
will also have ONE MORE pullback
to 1500 dollars before we have
a nice rally in April-May. Sit back
and relax...let the price action come
to you and get your FIAT ready to
go ALL IN if we hit .12 cents!!!
OH HELL YEAH BABY!!!

DOGEUSD preparing the final rally to $1.00Dogecoin / DOGEUSD has hit this month and so far holding its 1month MA50.
This Cycle isn't that different from the previous two, although it is naturally a not as aggressive as the market has matured.
According to the 1week RSI, the market is at the bottom of the final Bull Cycle pull back before the final rally for the Cycle Top.
We expect it to reach at least $1.00 by the end of this year.
Follow us, like the idea and leave a comment below!!

DOGEUSDWaiting for breakout. DOGECOIN looks to break on trendline to increase to 0.30.
Perfect time to invest cheaper.
open new investment in this time for long positions.

(DOGE) dogecoin "oversold indications"The price of Dogecoin is considered oversold based on an Elliott Wave custom pattern by DGT that I sometimes use to look for overbought and oversold signals. The four diamonds is similar to Jasmycoin's oversold signals.

MY 1:2.6 RR short for DogecoinMY 1:2.6 RR short for Dogecoin
A short-term short for DOGECOIN with a Risk/ Reward ratio of 1: 2.6
Trade with caution

Dogecoin - New All Time Highs Will Come!Dogecoin ( CRYPTO:DOGEUSD ) still remains bullish:
Click chart above to see the detailed analysis👆🏻
If you look at the chart above, you can see almost only green mark ups. That's because despite the recent drop, Dogecoin remains in a very bullish market and is overall clearly heading higher. If this break and retest now plays out, we will even see new all time highs in the future.
Levels to watch: $0.2, $0.5
Keep your long term vision,
Philip (BasicTrading)

DOGEUSD: This is why it can go to $2.00Dogecoin is bearish on its 1W technical outlook (RSI = 41.068, MACD = -0.006, ADX = 51.882) as it's trading under the 1W MA50. It did find however support on the 1W MA100 and that reminds us of the August-September bottoming period, which served as accumulation for the market, giving way to the post U.S. election rally. This chart shows DOGE's three Phases of Growth of the current Cycle. As the 1W MA100 holds, we have succesfully completed Phase 2 and have started Phase 3, which is technically the most bullish. The last Phase 3 topped a little over the 2.0 Fibonacci extension of Phase 1 bottom. This implies that a $2.00 TP by the end of Q3 is a technically achievable price.
## If you like our free content follow our profile to get more daily ideas. ##
## Comments and likes are greatly appreciated. ##

Dogecoin 12-month analysisDogecoin has become very popular with traders and investors, and this currency has had many downward fluctuations over the past period and is in a support range. You can expect an increase in this currency within 12 months with the first target of $0.40, and you can expect further increases from that price point. Keep in mind that every signal and analysis must be implemented with a risk and capital management approach specific to that analysis, otherwise, even if the price increases, the investment may not be made correctly.
Sasha Charkhchian
