DOGEUSD – Woof, Then WaitDOGE broke out from a coiled base around $0.166 and launched toward $0.174+. The move was impulsive with volume, but momentum is cooling as price forms a flag under highs. Bullish continuation likely if $0.1715 holds. A breakout over $0.175 would be trend-confirming.
DOGEUSD trade ideas

DOGEUSD – Grind Down, But StabilizingDOGE ripped above $0.1700 but couldn’t hold the gains. Price has stair-stepped down into $0.1580 and is now rebounding. A higher low may be forming if $0.1600 holds. Upside is capped by $0.1640–$0.1650, where prior support turned resistance sits. A flip of that zone would shift structure bullish again.

DOGEUSD: $1.100 is the minimum target.Dogecoin is bearish on its 1D technical outlook (RSI = 37.555, MACD = -0.00967, ADX = 29.193), suggesting that it is heavily undervalued in relation to the position it has during the same stage of the previous Cycles. All Cycles have smashed through the top red Mayer Multiple Band before pricing the Top. This means that by the end of the year, we can expect at least $1.100 for Doge (current projection of the Top Mayer Band).
## If you like our free content follow our profile to get more daily ideas. ##
## Comments and likes are greatly appreciated. ##

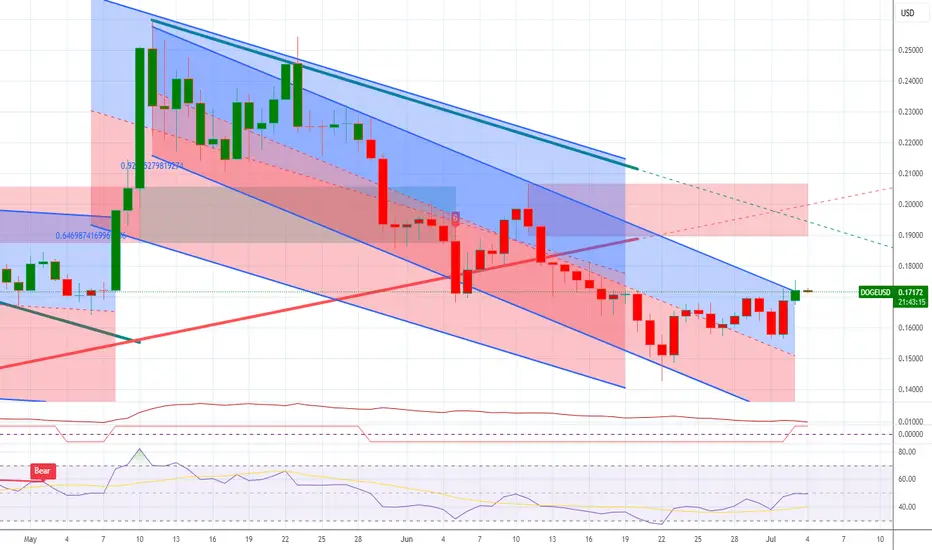
DOGE/USDT Preparing for a 50% Rally in July 2025If the short-term fractals are kept aside, the long-term price action displays huge potential for a continued ascending trend. After the latest rejection from a resistance zone between $0.2180 and $0.2327, the bulls are trying hard to elevate the levels back above $0.2, but the bears seem to have capitulated the range just below the resistance.
The weekly chart analysis suggests, the price has held the ascending trend line as a strong support and recently triggered a rebound. Besides, the weekly MACD, which has been within the negative range since the start of the year, displays a drop in selling volume and pressure. Meanwhile, the weekly DMI is about to turn bullish as the conversion line and base line are heading for a bullish crossover.
Key Technical Indicators Supporting the Rally
Golden Cross Formation: The 9 EMA has crossed above the 21 EMA—typically a bullish sign.
MACD Histogram: Green bars show growing positive momentum.
RSI Strength: RSI levels above 50 confirm bullish control.
Support Level: $0.155–$0.16
Resistance Target: $0.175–$0.18
A breakout above $0.18 could push DOGE toward the $0.20–$0.22 range, while a break below $0.155 might invite short-term pullbacks.

Dogecoin - This is the key structure!Dogecoin - CRYPTO:DOGEUSD - has to reverse now:
(click chart above to see the in depth analysis👆🏻)
A couple of months ago Dogecoin retested the previous all time high. We have been seeing a harsh correction of about -65% thereafter. However Dogecoin still remains in a bullish market with bullish structure. In order to validate this trend, a reversal must happen now.
Levels to watch: $0.15, $0.5
Keep your long term vision🙏🙏
Philip (BasicTrading)

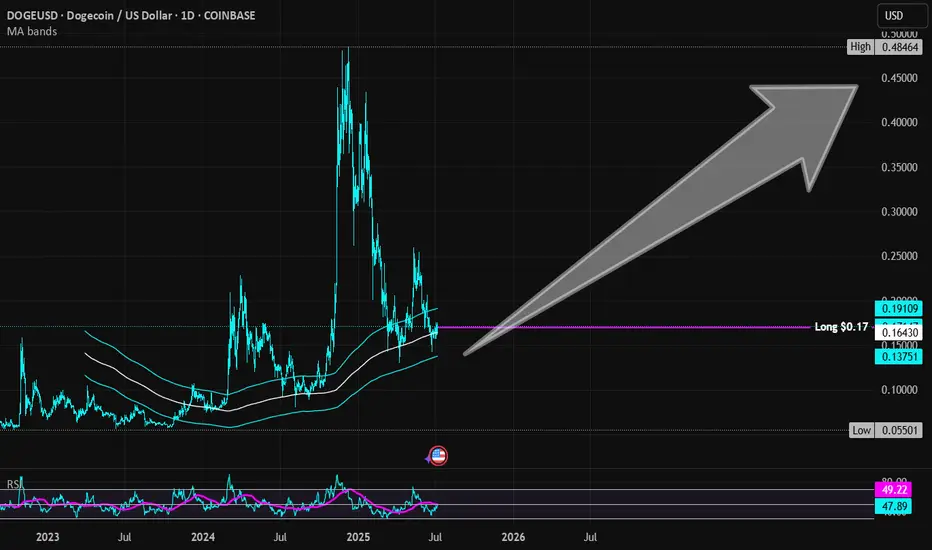
Dogecoin | DOGE | Long at $0.17Currently within my historical simple moving average area and consolidating. I suspect a move up is imminent, but 100% speculation. Crypto "bros" know more than I do.
Targets into 2028:
$0.25 (+47.1%)
$0.45 (+164.7%)
Dogecoin! time for a big move?Hello traders. A small update on the current situation.
The price has been in consolidation since March, and its triangle is ending, I am counting on a powerful breakout in the next 3 weeks. On the other hand, if the price does not stay above 0.16 cents in the next week, the price may dive to the limits of strong support at 0.12 cents. Below we have a master slide to the limits of 0.06 cents, but I am not counting on it! I am counting on your careful observations and advice.
Best regards

DOGE: is the correction over?The recent price action from end of June low is creeping up but not a very impulsive way. The drop from May high is in a 5 waves move. That makes things a bit open to interpretation. 5 waves move can both start or end a sequence. So, the question is, if the correction over already or if Doge is heading for another sharp move down. If the later, then we should expect price to drop in another 5 waves move down to 11c - 9c area. right below wave A, 13c area. If that happens, then it will be a solid buy for me. In no circumstances, price can fall below primary wave 4, 5.6c. If that happens then a much bigger primary wave 4 would be in progress and we should expect price to fall below 3c. If the correction is over and Doge is heading towards $1, then we should see the pullback very soon and sharp move above 26c. Price cannot break the 14c low. Only above wave B we can confidently say that the correction is over, and Doge is going towards $1. At the moment, still in a no man's land.
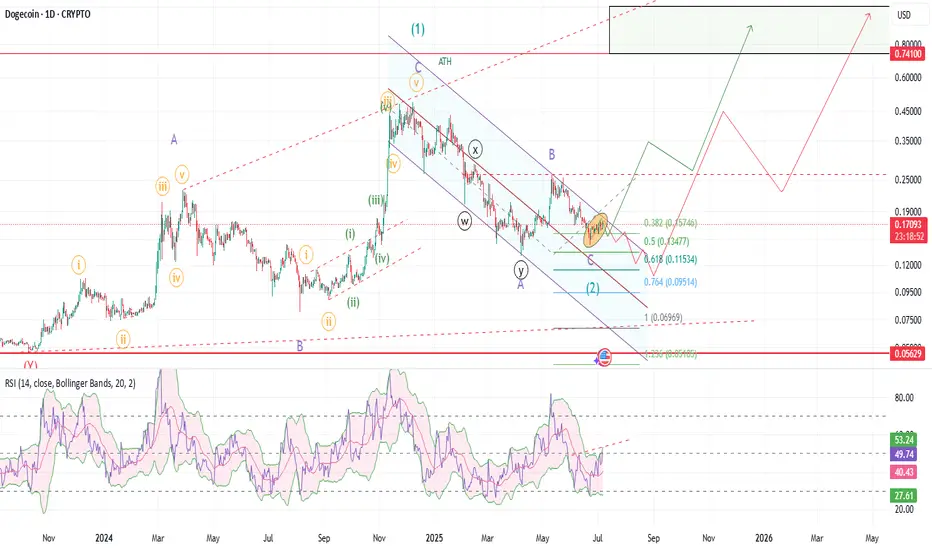
doge correction im simplify looking for a break-out above 0.25 in order to confirm a bullish reversal until this happens i will remain bearish and am looking for a bottom at 0.08 this is my worst case .

DOGEDOGE is waking up and starting to bark -- looking like accumulation nearing its end, markup inevitable 👀
One of My Most Profitable Crypto DOGEIt's Low BUY NOW BITFINEX:DOGEUSD
as you can tell barley anyone is talking about crypto, because it not rising, GOOD take advantage and buy the dip
Last year 2024 in January I've brought Dogecoin and by November I've gained +245% and took (200%) leaving the rest of my portfolio
Now it's another opportunity but now I'm telling you Guys & Girls BUY BUY BUY just Don't take my analyzation of the market LOOK AT IT, you can tell LONG TERM $$$ is on the way
BUy LoW SeLl High

Time to speculate with DOGEI'm not going to surprise anyone by saying that CAPITALCOM:DOGEUSD is a highly speculative asset with little to no fundamental backing. However, from a technical standpoint, it’s offering a very interesting opportunity.
A few years ago, DOGE formed a double bottom pattern that, after a long struggle, finally reached its target, delivering spectacular returns. Right now, the price is trading around the breakout level of that same pattern and is also sitting right on the red trendline support.
This setup presents a chance to buy in a zone with strong rebound potential, a tight stop loss, and a risk‑to‑reward ratio that could easily be 10 to 1.
Taking on that risk seems worthwhile given DOGE’s massive upside potential, especially with memecoin season likely around the corner, as Bitcoin’s post‑halving rally looks set to wind down later this summer.

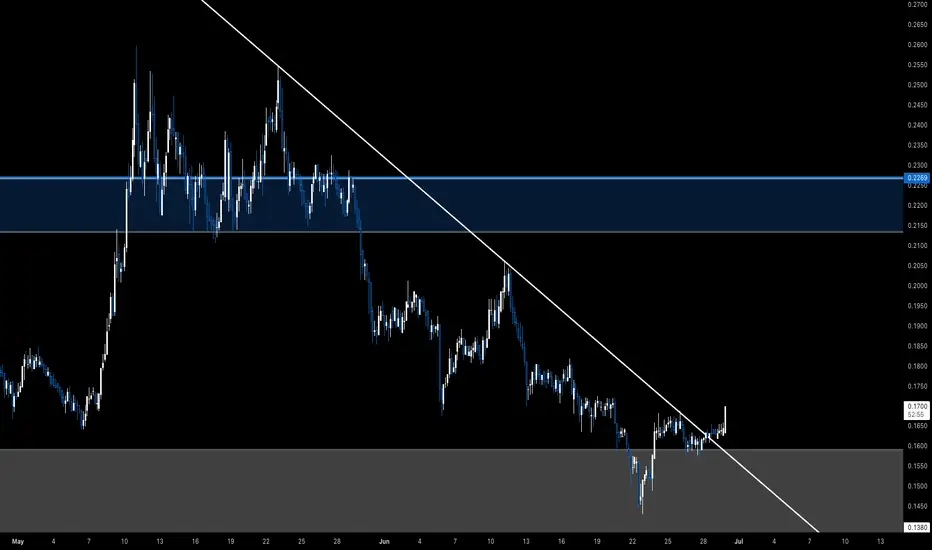
Doge H4 | Overlap resistance at 50% Fibonacci retracementDoge (DOGE/USD) is rising towards an overlap resistance and could potentially reverse off this level to drop lower.
Sell entry is at 0.1726 which is an overlap resistance that aligns closely with the 50% Fibonacci retracement.
Stop loss is at 0.1930 which is a level that sits above a pullback resistance.
Take profit is at 0.1494 which is a swing-low support.
High Risk Investment Warning
Trading Forex/CFDs on margin carries a high level of risk and may not be suitable for all investors. Leverage can work against you.
Stratos Markets Limited (tradu.com ):
CFDs are complex instruments and come with a high risk of losing money rapidly due to leverage. 63% of retail investor accounts lose money when trading CFDs with this provider. You should consider whether you understand how CFDs work and whether you can afford to take the high risk of losing your money.
Stratos Europe Ltd (tradu.com ):
CFDs are complex instruments and come with a high risk of losing money rapidly due to leverage. 63% of retail investor accounts lose money when trading CFDs with this provider. You should consider whether you understand how CFDs work and whether you can afford to take the high risk of losing your money.
Stratos Global LLC (tradu.com ):
Losses can exceed deposits.
Please be advised that the information presented on TradingView is provided to Tradu (‘Company’, ‘we’) by a third-party provider (‘TFA Global Pte Ltd’). Please be reminded that you are solely responsible for the trading decisions on your account. There is a very high degree of risk involved in trading. Any information and/or content is intended entirely for research, educational and informational purposes only and does not constitute investment or consultation advice or investment strategy. The information is not tailored to the investment needs of any specific person and therefore does not involve a consideration of any of the investment objectives, financial situation or needs of any viewer that may receive it. Kindly also note that past performance is not a reliable indicator of future results. Actual results may differ materially from those anticipated in forward-looking or past performance statements. We assume no liability as to the accuracy or completeness of any of the information and/or content provided herein and the Company cannot be held responsible for any omission, mistake nor for any loss or damage including without limitation to any loss of profit which may arise from reliance on any information supplied by TFA Global Pte Ltd.
The speaker(s) is neither an employee, agent nor representative of Tradu and is therefore acting independently. The opinions given are their own, constitute general market commentary, and do not constitute the opinion or advice of Tradu or any form of personal or investment advice. Tradu neither endorses nor guarantees offerings of third-party speakers, nor is Tradu responsible for the content, veracity or opinions of third-party speakers, presenters or participants.

Doge Coin Stock Chart Fibonacci Analysis 062325Trading Idea
1) Find a FIBO slingshot
2) Check FIBO 61.80% level
3) Entry Point > 0.15/61.80%
Chart time frame:C
A) 15 min(1W-3M)
B) 1 hr(3M-6M)
C) 4 hr(6M-1year)
D) 1 day(1-3years)
Stock progress:A
A) Keep rising over 61.80% resistance
B) 61.80% resistance
C) 61.80% support
D) Hit the bottom
E) Hit the top
Stocks rise as they rise from support and fall from resistance. Our goal is to find a low support point and enter. It can be referred to as buying at the pullback point. The pullback point can be found with a Fibonacci extension of 61.80%. This is a step to find entry level. 1) Find a triangle (Fibonacci Speed Fan Line) that connects the high (resistance) and low (support) points of the stock in progress, where it is continuously expressed as a Slingshot, 2) and create a Fibonacci extension level for the first rising wave from the start point of slingshot pattern.
When the current price goes over 61.80% level , that can be a good entry point, especially if the SMA 100 and 200 curves are gathered together at 61.80%, it is a very good entry point.
As a great help, tradingview provides these Fibonacci speed fan lines and extension levels with ease. So if you use the Fibonacci fan line, the extension level, and the SMA 100/200 curve well, you can find an entry point for the stock market. At least you have to enter at this low point to avoid trading failure, and if you are skilled at entering this low point, with fibonacci6180 technique, your reading skill to chart will be greatly improved.
If you want to do day trading, please set the time frame to 5 minutes or 15 minutes, and you will see many of the low point of rising stocks.
If want to prefer long term range trading, you can set the time frame to 1 hr or 1 day.

DOGEUSD 4H Chart Analysis - Bullish Breakout in Play!✅ Buy Setup - Retest Opportunity After Breakout
Dogecoin has broken out of the previous resistance area near 0.17000, showing strong bullish momentum. Price has created a clean bullish structure, and buyers are in control.
Buy Zone:
Look for potential entries between 0.17000 - 0.17150 if price retests this zone.
---
📊 Trade Setup Details
Buy Entry: 0.17150 (Wait for bullish rejection confirmation)
Stop Loss (SL): 0.16850 (Below previous structure support)
Take Profit 1 (TP1): 0.17550 (First bullish target)
Take Profit 2 (TP2): 0.18000 (Psychological resistance zone)
---
⚠️ Risk Management Tip
Only enter after bullish confirmation candle at the buy zone.
Maintain risk-reward above 1:2 for optimal trade setup.
Watch for momentum around 0.17550, price may pause or pull back.
---
💡 Market Sentiment
Breakout structure indicates bullish strength.
As long as price holds above 0.17000, bullish continuation expected.
Failure to hold above 0.17000 invalidates this buy setup.
---
#DOGEUSD #Dogecoin #CryptoBreakout #TradingView #BuySetup #CryptoSignals

A time for a big bounce?#DOGE finally hit the ascending support blue line which form back in August 2024 with a price of $0.15. This is also a bottom of the descending yellow channel.
Whenever DOGE made it down to this blue support trend line, it made huge bounces.
Expect DOGE to bounce to at least an upper level of this channel. Will it break above this channel? Time will tell. Good Luck !

DOGE: Accumulation ???Hello,
DOGE looks to bottom very soon, once the bottom is in with in few days, I expect it to to higher very fast and create a base above $0.25
I'm expecting above .30 with in August as per the charts.
Best to accumulate when the prices are low and take profits when technicals are hit.
happy trading
CAPITALCOM:DOGEUSD

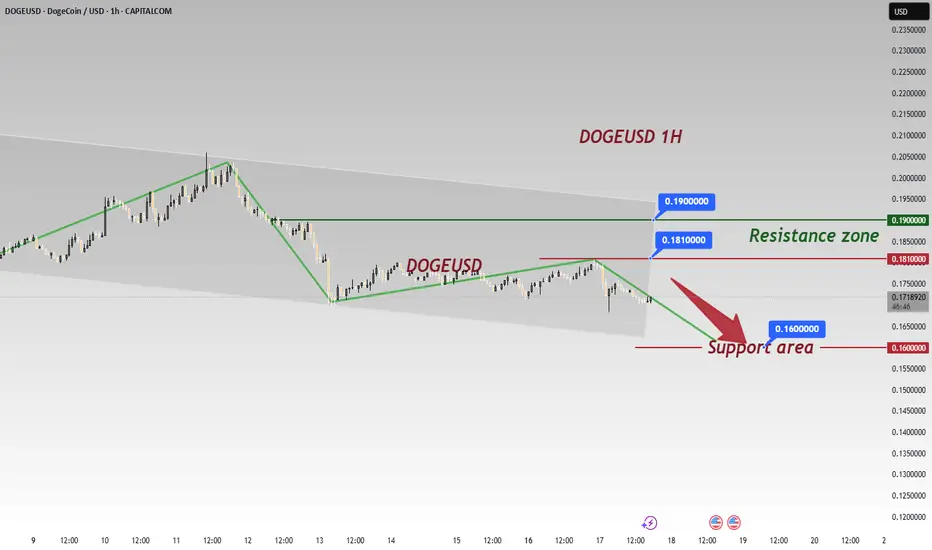
DOGEUSD 1H Technical AnalysisTrend & Key Levels 🎯
DOGEUSD is in a downtrend after breaking the short - term uptrend line.
Resistance: 0.1810 - 0.1900 zone (previous suppression, 👀 watch for pullback risks if price rebounds here).
Support: 0.1600 (critical level; a break could deepen declines 💣).
Signals 📡
Trend Break: The broken uptrend line confirms bearish control 🐻; failing to reclaim it on a rebound keeps the downtrend.
Price Action: Dominant bearish candles (with implied heavy selling 💰💨) show strong downside momentum.
Range Play: Price is testing 0.1600 support. A hold may spark a bounce 🚀; a break opens further downside (check larger timeframes for prior lows 🔍).
⚡️⚡️⚡️ BTCUSD ⚡️⚡️⚡️
🚀 Sell@ 0.17500 - 0.17000
🚀 TP 0.16500 - 0.16000
Accurate signals are updated every day 📈 If you encounter any problems during trading, these signals can serve as your reliable guide 🧭 Feel free to refer to them! I sincerely hope they'll be of great help to you 🌟 👇
Dogecoin - Don't forget the dog now!Dogecoin - CRYPTO:DOGEUSD - still remains quite bullish:
(click chart above to see the in depth analysis👆🏻)
Basically during every major bullrun on Dogecoin, we always saw a correction of at least -60%. Therefore the recent drop of -70% was not a surprise at all but rather a natural all time high rejection. If Dogecoin manages to now create bullish confirmation, the bullrun will continue.
Levels to watch: $0.2. $0.5
Keep your long term vision!
Philip (BasicTrading)

Dogecoin Ready for Bounce? Key Demand Zone Holding Strong!DOGEUSD has once again tapped into the high-confluence demand zone near $0.171, where price previously reversed sharply. Bulls are now watching closely for a potential bounce setup, with momentum expected to build into the coming sessions. 👇
🔍 Chart Breakdown:
🔸 Current Price: $0.1713
🔸 Strong Support Zone: $0.1710 – $0.1702 (orange box)
🔸 Mid-Term Resistance: $0.1862
🔸 Major Supply Zone: $0.2004 – $0.2040
Price action is respecting the lower boundary of the demand zone, and if this level holds, we could see a bullish reversal play toward: ✅ Target 1: $0.1862
✅ Target 2: $0.2004 (supply zone & previous rejection area)
💡 Trade Idea (Not Financial Advice):
Watch for bullish candlestick confirmation from this zone. A solid 4H close above $0.175 could trigger upside continuation.
📅 Upcoming Fundamentals:
Multiple USD-related events are approaching, which may increase volatility. Stay alert!
---
🐕 Community Insight:
Dogecoin remains a community-driven asset with high speculation potential. Combine technicals with sentiment and volume for stronger conviction.
💬 What do you think? Is DOGE ready to bounce or will bears break this zone? Drop your thoughts in the comments!
#DOGE #Dogecoin #Crypto #Altcoins #TechnicalAnalysis #SupportResistance #CryptoTrading #PriceAction #TradingView #DOGEUSD #LuxAlgo #BullishSetup

Dogecoin Recovers from Sharp Dip, Faces ResistanceDogecoin (DOGE) plunged hard below $0.17, then bounced back with a steady grind. Price is now consolidating near $0.177 but lacks strong momentum to push higher, forming lower peaks.
This retrace was never weakness — it was refinementDOGE delivered the exact narrative I’ve come to expect from algorithmic flow on the low timeframes. This wasn’t about volatility. This was about cleanup.
The play:
After the initial spike, price formed a visible FVG and retraced into the 0.5–0.618 fib zone. That’s not random — that’s rebalancing. Not only did we see a fade into the midpoint, but volume increased into the dip, not out of it.
What this does is simple: it clears out early longs, taps deeper liquidity, and prepares for re-delivery — all while structure remains intact.
Expectation:
Two paths are mapped — both favoring upside:
Ideal scenario: sweep 0.618 or 0.786 (down to 0.1726) → quick rejection → rally back into the FVG and above
Conservative: hold above 0.1761 fib (0.5) and slowly grind into 0.1795
Final target remains the inefficiency fill near 0.1825
Risk profile:
Entry: 0.174–0.176 zone
Invalidation: below 0.169
TP1: 0.1795
TP2: 0.1825
I’m not interested in chasing. I’m interested in absorption. This is where smart entries are born — deep in discount, backed by displacement.
Final word:
“If you can’t see the intention behind the pullback, you’re not trading Smart Money — you’re reacting to it.”
