Is the DOGE era over?⚡️ Hello everyone! For a long time, DOGE remained one of the main symbols of the crypto industry and a leader among meme coins.
But lately, the token has been looking frankly gloomy, and even Elon Musk can hardly pump it up. Is the DOGE era really over? Let's figure it out!
📊 Technical Analysis:
DOGE continues to be in correction and has now formed a flag on the daily chart and may soon break through one of the sides. It will likely choose a direction for movement in the near future, but which one is most likely?
There is a small GAP above the current price at 0.28 - 0.323. And as we know, 99% of GAPs close sooner or later. At the same time, the token is now trading at last year's local top levels, which is one of the key supports in this cycle.
⚙️ Metrics and indicators:
Volume - throughout the correction, sales volumes continued to weaken, forming a divergence. However, it is barely noticeable and practically flat, which means that sales volumes in the token remain high.
DMF - liquidity is in harmony with the price, and capital outflow from DOGE has been ongoing throughout this period. There is virtually no inflow of fresh liquidity. Without it, the asset will not be able to return to growth.
DSRZ - strong support level at approximately 0.134 - 0.119. This means that even current levels are considered overvalued and real demand will start significantly lower.
🌐 Fundamentals:
DOGE was a symbol, one of the first memecoins. But this is a memecoin super cycle, as it was dubbed in X. And now there are so many new and relevant memes, including in the top 100, that it is simply impossible to count them all.
In addition, DOGE was primarily associated with Elon Musk. But even his antics have become commonplace, and he rarely manages to pump the token price high. Moreover, last year, the mascot depicted on the DOGE token itself died, and now it is only a tribute to his memory.
📌 Conclusion:
During the recent rebound, when memecoins were giving hundreds of percent returns, DOGE looked frankly weak. The volumes were negligible. And the ongoing liquidity outflow, which has been going on for more than six months, only confirms the loss of interest among holders.
At the moment, the asset is slowly dying, and in order to really start attracting interest, it needs to drop significantly lower to become the subject of speculation again.
And I think this level is even lower than 0.11. Then it will become really attractive. Although it is difficult to assess whether DOGE is overvalued or undervalued, because it is a meme coin. But at levels below 0.119, I personally start to consider it for spot purchases.
DOGEUSDT trade ideas

DOGE Short Setup in Play—Targeting $0.13258 and $0.08840The broader price structure of DOGEUSDT continues to reflect a clear downtrend, with price consistently printing lower highs and lower lows. This trend is well-respected, as shown by the descending blue trendline, which has acted as dynamic resistance since early 2025.
In late April to early May, DOGE saw a sharp rally, briefly breaking above the trendline. However, this move turned out to be a false breakout against the trend, highlighted on the chart with a label and visual marker. The breakout failed to sustain above resistance and quickly reversed, trapping bullish traders and reaffirming the bearish dominance. This type of price action often signals a bull trap, and in this case, the reversal was swift and aggressive.
The price has since declined and is currently trading around the $0.18258 region, hovering just below the local resistance and just above the initial support levels.
Key Levels Observed on the Chart
• Stop-Loss / Resistance Zone:
The red resistance area around $0.20930–$0.22643 marks a critical stop-loss zone for any short positions. This is the top boundary where the false breakout failed and where sellers previously regained control.
• Entry / Decision Zone:
Price is currently within a small neutral box (shown in light blue), indicating a potential short entry zone as price consolidates below resistance.
• Key Support Level 1 / Take Profit 1:
$0.13258 – This level has been labeled as the first major support and serves as the initial take-profit zone for short setups. Historically, this zone has held price during strong down moves, and it aligns well with past structure.
• Key Support Level 2 / Take Profit 2:
$0.08840 – The second support level is marked as a deeper profit target for continuation of the downtrend. This level is closer to multi-month lows and reflects potential bearish extension.
• Final Support Base:
$0.05000 – This level is the lowest green horizontal line on the chart, showing long-term structural support. If macro conditions worsen, this remains a plausible downside target.
Detrended Price Oscillator (DPO) Indicator
The DPO reading remains below zero at approximately –0.04, reinforcing the bearish momentum. The indicator does not show any bullish divergence, suggesting that there’s currently no sign of an upward reversal forming. The gradual downward slope of the DPO supports the probability of a continuation move to the downside.
Trade Setup (Short Bias)
• Entry Zone: $0.18258 – $0.18546 (current price range just under resistance)
• Stop-Loss: $0.20930 (above key resistance where breakout failed)
• Take Profit 1: $0.13258
• Take Profit 2: $0.08840
• Extended Bearish Target: $0.05000
Conclusion
DOGEUSDT continues to respect its long-term bearish structure, and the recent false breakout further validates the dominance of sellers. The failed attempt to reverse the trend above $0.20930 provides a well-defined stop for short setups, while the clean stair-step structure of support levels offers logical take-profit zones.
Unless DOGE manages to close above the $0.20930–$0.22643 resistance band with strong follow-through, the current bias remains bearish. Traders can monitor for short opportunities while protecting capital above the invalidation zone.

DOGE - Critical support - Going Up. Going up if support holds. Higher low. Next resistance 25c. Enter new long. 18.5c. Tight stop loss.

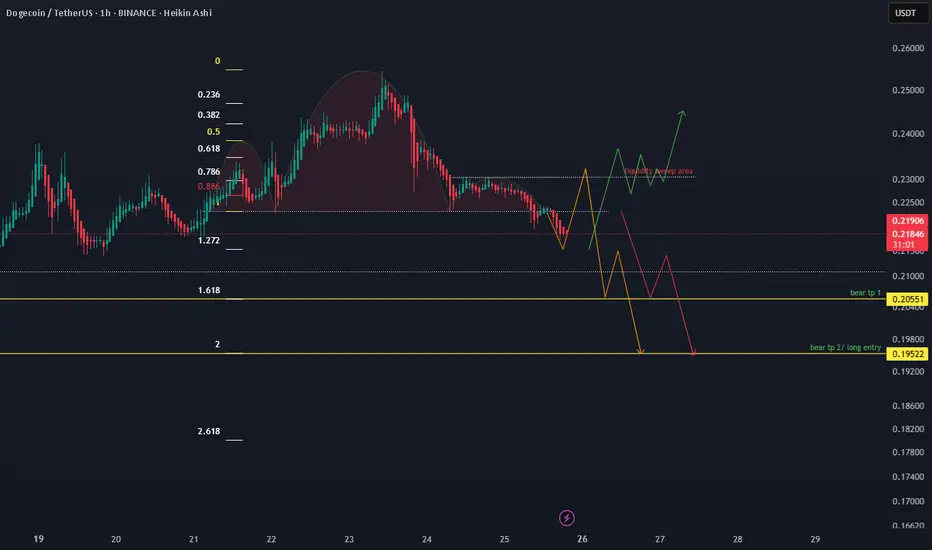
Doge possible bounce area in 1hr tfDoge has formed a bearish pattern on the 1-hour timeframe, with potential targets at 0.206 and 0.196.
I wouldn’t take a short entry here. Instead, I’ll wait for a bounce. Shorting now would be a counter-trade.
I’ve drawn a possible bounce zone, with a good entry point around the shorters’ TP2 at 0.196.
Another scenario involves a liquidity sweep before dropping to TP2, which would indicate a stronger bearish move.
The last possibility is a break above the liquidity sweep area, followed by consolidation and either a new high or a bullish structure formation. In that case, we could consider buying in that zone.
Dogecoin coin Wave Analysis – 5 June 2025
- Dogecoin broke key round support level 0.2000
- Likely to fall to support level 0.1600
Dogecoin cryptocurrency is under bearish pressure after the earlier breakout of the key round support level 0.2000 (former strong resistance from March) coinciding with the support trendline of the daily up channel from March.
The price briefly corrected up to test the broken price level 0.2000 (acting as the resistance after it was broken) – after which it continued to fall in the active impulse wave 3.
Dogecoin cryptocurrency can be expected to fall to the next support level 0.1600, former low of wave (iv) from the start of May.
Doge 1.66 RR tradeDoge has not hit its larger target, therefore I think this would be a decent short-term long

DOGE/USDT – Key Support Holding for Possible 194% Rally
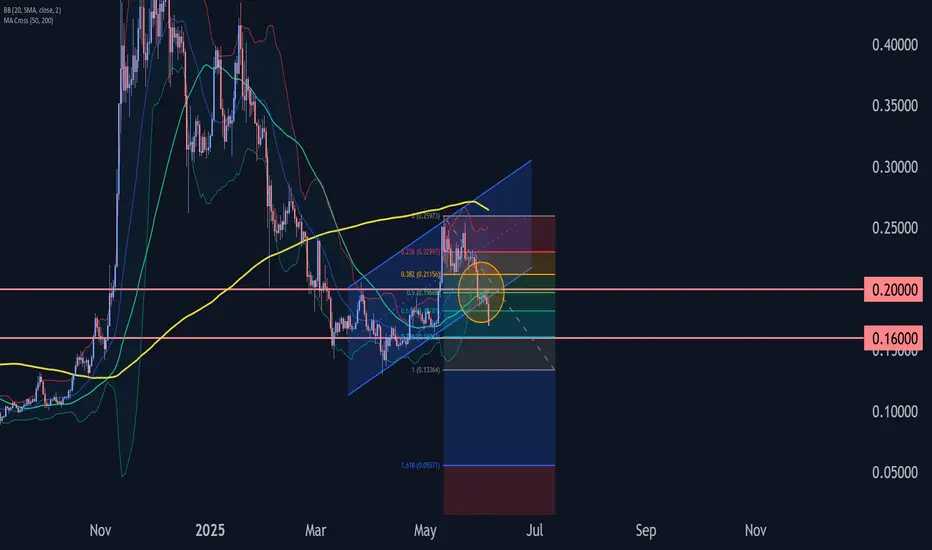
Dogecoin has recently shown renewed signs of strength after reacting positively to the 200-week moving average. This level acted as a major dynamic support and helped ignite a bullish impulse from oversold conditions. The response from this zone suggests potential accumulation and a shift in short-term sentiment.
The most important level to watch is the $0.16 support. This zone is critical for the bullish thesis to remain intact. If price holds above this level, it increases the probability of a continued rally, especially with recent market structure favoring higher lows.
From a technical perspective, Dogecoin has now broken above a short-term descending trendline. This breakout, coupled with sustained strength above the 200-week MA, may set the stage for a significant move to the upside. The ultimate technical target remains the all-time high zone near $0.48, which represents a potential 194% gain from current levels.

DOGEUSDT 1D Analysis DOGE ~ 1D Analysis
#DOGE Buy back gradually from here with a short term target of at least 15%+ from here.

DOGEUSDT 0.2550 TPWe are seeing a price rebound from strong support around the ~0.1900 level, which may signal the end of the correction. A potential double bottom formation is forming, which often indicates a trend reversal to the upside.
Additional arguments:
The WT_LB oscillator shows an oversold zone and initial upward curvature of signal lines – a typical buy signal.
After a strong downtrend, a consolidation phase has occurred, likely acting as an accumulation zone before a potential move upward.
The risk-to-reward ratio (R/R) is very favorable (around 1:5), supporting a long entry at the current market structure.
📌Technical signals and a strong R/R ratio support a bullish scenario, with a target around 0.252 and a stop-loss set near 0.185.

They see relief. I see rebalancing.BINANCE:DOGEUSDT.P isn't bullish — it's rebalancing. What we’re witnessing now is price doing what it always does after manipulation: return to efficiency before delivering its next displacement.
Here’s the setup:
Price tapped into the 4H discount zone — a structural STB
We’re now reacting from the 0.618 (0.1940) and pushing up toward the 4H OB at 0.20403
That OB is perfectly nested just above the 0.5 fib (0.20190), and below the 0.382 (0.20970) — prime for internal liquidity collection
If price fails to break structure above that 4H OB, the move is complete. This isn’t bullish continuation — it’s cleanup. From there, I’m watching closely for signs of rejection and displacement back toward the OB + BTS zone near 0.16884.
This is where real risk is priced in — and where Smart Money actually loads up.
Execution mindset:
Let price reach into 0.204–0.209
Watch for rejection — that’s the trigger
Downside target: 0.18299 → 0.16884
If we impulsively break 0.2097 and reclaim it, the bearish thesis is invalidated and I’ll re-evaluate
This isn’t trading a bounce. It’s reading the cleanup.
You want real entries, real invalidations, real structure? Check the profile description. The trades speak louder than the noise.

How to Spot the Perfect Dogecoin Buy Signal!Dogecoin (DOGE) is showing another major bullish signal!
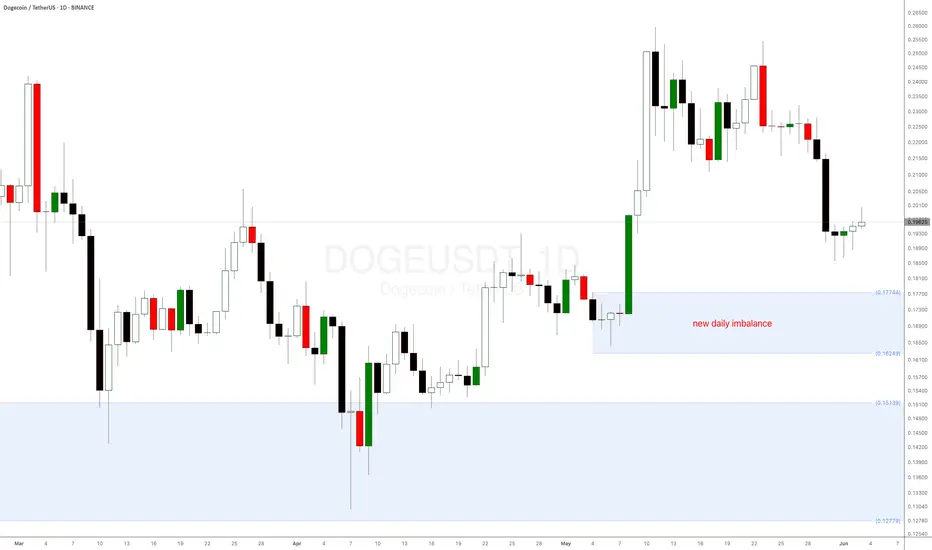
After bouncing from the key weekly demand level at $0.151 mentioned in a previous supply and demand crypto analysis, DOGE coin is now approaching a new daily demand imbalance at $0.18035—a level where buyers have historically stepped in aggressively.
Why This Matters:
Strong Reaction Expected: Similar imbalances on other altcoins have led to sharp upward moves.
Long-term weekly imbalance: The weekly demand level is playing out very well.
Dogecoin (DOGE), the world’s favourite meme cryptocurrency, is trying to reach a critical weekly demand level at $0.151—its strongest daily demand zone in a long time! This presents a prime buying opportunity, especially for crypto beginners looking to enter the market.
Check the previous DOGE analysis from a few weeks ago.
Price tapped the discount — now it’s time to test premium.This setup on DOGE/USDT was mechanical. Not emotional.
I’ve seen this formation enough to know what comes next. The chart has already spoken.
After a clean markdown into the 4H OB, price hit the 0.786 retracement level — right inside a prior imbalance zone. That wasn’t a random drop. That was engineered. Liquidity was swept, sentiment reset, and now we have structure ready to reverse.
Notice this:
We’re sitting in a 4H demand OB with confluence from the FVG just above.
The Fibonacci levels are aligning with Smart Money delivery: 0.5 sits right at the base of the new rally expectation.
The 0.20928 level is the first key reaction point — I expect a stall or consolidation there.
But the real test comes higher: the 0.22094 OB, which also aligns with the 0.382 fib level — the market’s threshold between discount and premium.
I’ll be watching price closely on its approach into that 0.209–0.22094 region. If it delivers clean displacement through FVG, the next liquidity grab sets up a premium continuation model.
If we reject early — that tells me distribution is starting, and I’ll prep for a secondary sweep below 0.18 to retest the deeper 4H OB near 0.16387.
This setup didn’t require a confirmation signal.
It required understanding why price dropped — and where it’s designed to go.
I don’t need to guess. I just need to be aligned.

DOGE LONG SETUP ALL trading ideas have entry point + stop loss + take profit + Risk level.
hello Traders, here is the full analysis for this pair, let me know in the comment section below if you have any questions, the entry will be taken only if all rules of the strategies will be satisfied. I suggest you keep this pair on your watchlist and see if the rules of your strategy are satisfied. Please also refer to the Important Risk Notice linked below.
Disclaimer

DOGE Ready for PUMP or what ?What I see now is that the price could correct to the PRZ and then pump again, and currently, there is no specific bullish pattern in the chart. which could cause the price to drop below 17 cents.
Best regards CobraVanguard.💚

The key is whether it can find support at 0.18951 and go up
Hello, traders.
If you "Follow", you can always get new information quickly.
Have a nice day today.
-------------------------------------
(DOGEUSDT 1D chart)
It touched the A section, which was the previous breakout trading section, again.
That is, if it is supported and rises near 0.18951, it is a time to buy.
If not, it will fall below the M-Signal indicator of the 1M chart, so caution is required when trading.
This is because in order to continue the upward trend in the medium to long term, the price must be maintained above the M-Signal indicator of the 1M chart.
Therefore, a short and quick response is required when trading below the M-Signal indicator of the 1M chart.
-
The channel of the High Line ~ Low Line of the OBV indicator is showing signs of turning into a downward channel.
Therefore, you should check whether the OBV shows signs of rising above the High Line.
-
The basic trading strategy is to buy near the HA-Low indicator and sell near the HA-High indicator.
It currently meets the HA-High indicator and falls to meet the HA-Low indicator.
Therefore, this wave should be interpreted as closed.
Therefore, a new wave will start from the HA-Low indicator that we met this time.
If it falls from the HA-Low indicator, it is likely to show a stepwise downtrend, and if it rises from the HA-High indicator, it is likely to show a stepwise uptrend.
Therefore, we need to check whether the HA-Low indicator supports the new wave to see if it is a downtrend or an uptrend.
-
Thank you for reading to the end.
I hope you have a successful trade.
--------------------------------------------------
- This is an explanation of the big picture.
(3-year bull market, 1-year bear market pattern)
I will explain more details when the bear market starts.
------------------------------------------------------

DOGE Futures Weekly Outlook — June 1, 2025🐶 DOGE Futures Weekly Outlook — June 1, 2025
🚨 AI Model Consensus: Strong Bearish Bias Across the Board
🧠 Model Breakdown
🔹 Llama (Meta)
Technicals: Below all major MAs; RSI neutral; hugging lower Bollinger Band.
Sentiment: Bearish news; neutral funding.
Trade: Short @ 0.20 → TP 0.18, SL 0.22
Confidence: 80%
🔹 Gemini (Google)
Technicals: Below SMAs & EMAs, RSI ~40, bearish MACD.
Sentiment: Strong negative headlines; neutral funding.
Trade: Short @ 0.19 → TP 0.16, SL 0.205
Confidence: 85%
🔹 DeepSeek
Technicals: Bearish across all timeframes; RSI nearing oversold.
Sentiment: Capitulation signs in sentiment.
Trade: Short @ 0.19 → TP 0.175, SL 0.195
Leverage: 50× | Notional: $1,000
Confidence: 85%
✅ Consensus Summary
📉 All models agree: Strong Downtrend
Price < all key MAs
MACD bearish
RSI near oversold
Sitting at or below lower Bollinger Band
📰 News flow: Negative across sources
⚠️ Volatility high → manage risk tightly
🔄 Model Differences
Factor Range / Notes
🎯 Entry 0.19 – 0.20
🛑 Stop Loss 0.195 – 0.22
🎯 Take Profit 0.16 – 0.18
📈 Leverage 1× to 100× (use your risk tolerance)
Claude abstained due to confidence <75%, but all others support a short trade setup.
📊 Recommended Trade Setup
💡 Strategy: Short DOGE Futures
🐶 Instrument: DOGE
📉 Direction: SHORT
💰 Entry Price: 0.19
🎯 Take Profit: 0.16
🛑 Stop Loss: 0.205
📏 Size: 1 contract (adjust for 1% equity risk)
📈 Confidence: 85%
⏰ Entry Timing: Market Open
⚠️ Risk Factors to Monitor
RSI nearing oversold—bounce risk
Volatility may trigger stops quickly
DOGE is tightly correlated with BTC — watch Bitcoin
Any major AI/crypto news may widen the move or reverse bias
📊 TRADE DETAILS (JSON)
json
Copy
Edit
{
"instrument": "DOGE",
"direction": "short",
"entry_price": 0.19,
"stop_loss": 0.205,
"take_profit": 0.16,
"size": 1,
"confidence": 0.85,
"entry_timing": "market_open"
}

Buy limit
### Important and main block order ### can cause a return and reaction to the level. ### In the low time frame, wait for the first ceiling to break and trade when hitting the block!!!! ###buy limit###choch

DOGE – Monthly Round Bottom Test🐶 CRYPTOCAP:DOGE is testing the round bottom support line on the monthly timeframe.
👀 Watch closely — either a bounce or rejection could shape the next big move!
🟢 Stay alert! GATEIO:DOGEUSDT CRYPTOCAP:DOGE

DOGE ShortOne of the ones that looks good for short. I entered a little bit from here, I will add a little bit more with the trend break.
I am short-biased because I think there will be a correction in my general market bias. After a correction I will look for long positions

Doge which path? Red or green? take your pick, on HTF honestly pretty interesting for sure, worth keeping an eye just how we did back in last cycle with XRP

Short trade
1Hr overview
📘 Trade Journal Entry — DOGEUSDT (Sell-side Trade)
🗓 Date: Friday, 30th May 2025
⏰ Time: 3:00 PM
📍 Session: Tokyo to London PM
📈 Timeframe: 1hr (intraday/swing)
📊 Market Structure Tool: Price Action — Lower Highs + Liquidity Sweep
🧠 Confirmation Tool: Bearish structure break + Premium pricing zone
🔹 Trade Details:
Entry Price: 0.20466
Take Profit: 0.18205 (−11.05%)
Stop Loss: 0.20691 (+1.10%)
Risk-Reward Ratio: 10.05
🔹 Market Structure:
Bearish price action is evident, characterised by a sequence of lower highs and lower lows.
Entry aligned with price returning to the premium zone before resuming its downward trend.
Liquidity Sweep & Confirmation:
Entry followed a sweep of local highs, indicating engineered liquidity.
Immediate rejection at the sweep point and entry at the confirmation candle.
Momentum:
Strong bearish momentum post-entry, with volume confirming sell-side intent.

#DOGEUSDT: Upcoming Big Bullish Move| Crypto| Setupsfx_| BINANCE:DOGEUSDT price is still bearish, however, after some point we can see strong bullish volume kicking in the market. After NFP today, we might see price dropping a little more until it reaches our area of entry. From which we can see strong price rebound towards our target area which would be 0.23.
We wish you all the best and always maintain a great risk to reward ratio.

#DOGEUSDT: Swing Buy Coming Up, Get Ready Dear Traders,
Price of Dogecoin has dropped similarly to the other crypto pairs, price is on the way to fill the void area and then we can see price reversal. Wait for price to drop a bit more than you can enter a buy entry, taking price to a new level.
