doge buy midterm "🌟 Welcome to Golden Candle! 🌟
We're a team of 📈 passionate traders 📉 who love sharing our 🔍 technical analysis insights 🔎 with the TradingView community. 🌎
Our goal is to provide 💡 valuable perspectives 💡 on market trends and patterns, but 🚫 please note that our analyses are not intended as buy or sell recommendations. 🚫
Instead, they reflect our own 💭 personal attitudes and thoughts. 💭
Follow along and 📚 learn 📚 from our analyses! 📊💡"
DOGEUSDT trade ideas

Dogecoin is not ready for a big growth...The equilibrium analysis of the 3-hour chart of Dogecoin from two major peaks (December 2024 and January 2025) tells us that the main equilibrium zone of both major trends has been broken in this timeframe and in the medium term the candles will move towards the middle zone of these two major trends... In the medium term the downside targets of 0.10 and 0.07 will be touched... Fundamental news or the game of whales may be able to cause a slight delay in the equilibrium path of the chart, but ultimately the candles will move towards the mentioned downside targets.
Note: Equilibrium analyses look at the chart on a large scale and in a macro way... We may be delayed in reaching the target, but the targets will be touched...

Long trade
5min TF ovewrview
📘 Trade Journal Entry
DOGEUSDT (Buy Side)
🗓 Date: Monday, 5th May 2025
⏰ Time: 12:00 PM
📍 Session: London to New York PM Transition
🪙 Pair: DOGE/USDT
📈 Direction: Long (Buy Side)
🔹 Entry Details:
Entry Price: 0.16894
Take Profit: 0.17375 (+2.85%)
Stop Loss: 0.16884 (−0.06%)
Risk-Reward Ratio: 48.1
🔹 Trade Context:
Executed during the London–New York PM crossover, often a key window for major intraday reversals or trend continuations. Market structure showed a series of higher highs, confirming bullish intent and sustained buyside pressure.

doge buy midterm"🌟 Welcome to Golden Candle! 🌟
We're a team of 📈 passionate traders 📉 who love sharing our 🔍 technical analysis insights 🔎 with the TradingView community. 🌎
Our goal is to provide 💡 valuable perspectives 💡 on market trends and patterns, but 🚫 please note that our analyses are not intended as buy or sell recommendations. 🚫
Instead, they reflect our own 💭 personal attitudes and thoughts. 💭
Follow along and 📚 learn 📚 from our analyses! 📊💡"

Long trade
15min TF overview
Entry — DOGEUSDT (Buy Side)
🗓 Date: Monday, 5th May 2025
⏰ Time: 2:30 AM
📍 Session: Tokyo to London AM Transition
Pair: DOGE/USDT
📈 Direction: Long (Buy Side)
🔹 Entry Details:
Entry Price: 0.17316
Take Profit: 0.17465 (+0.86%)
Stop Loss: 0.17277 (−0.23%)
Risk-Reward Ratio: 3.82
🔹 Trade Context:
Entered during the Tokyo–London session transition, where directional momentum often begins to form. Structure showed higher highs, indicating sustained buyside pressure. Entry aligned with a respected Fair Value Gap (FVG), which held the price
🔹 Trade Reasoning:
✅ Buyside pressure confirmed through price action
✅ Higher highs forming on the intraday chart
✅ Entry from a respected FVG, confirming support

Dogecoin: Should I Sell Everything Before The Crash?I want your attention focused on the (3).
On the chart, left side, (1) and (2) is a sequence of low and lower low. (3) is a higher low.
On the right side of the chart, (1) and (2) is a sequence of low and lower low. (3) is a higher low.
On the left , after (3) there was a massive bullish wave.
On the right, (3) will lead to a very strong bullish cycle and phase. The strongest growth period since the 2021 bull market.
Should I sell everything before the crash?
Panic buy. Buy like it is the end of the world.
Buy more, buy and hold while focusing on the long-term.
Never use a stop-loss. Remove any stop-loss orders now and if prices drop, make sure to buy as much as you can because Dogecoin is about to grow really strong in the coming days.
Retraces are an opportunity to buy-up and reload. If you can't buy more, just hold.
No selling at this point. Only sell when prices are hitting new highs. This is the perfect time to buy and hold!
Namaste.

This is how to read the chart using Weis Wave with Speed IndexReading the chart:
1. We have bottom down and we pull back with high up volume waves, approaching the Fib area. Notice how SI is increasing on the up waves as we are reaching Fib from 13.3 to 15.7 to 18.4 and last not able to break previous resistance at 20.4. This means sellers are absorbing all buy orders of people entering long thinking that the trend will continue.
2. Notice the up volume wave with SI 20.4 and respective pip move right above it which is small compared to the amount of volume used - This is absorption.
3. The highest PVR bar at the beginning of the down wave - more sellers
4. Entry Short on the Plutus Short signal
Notice all the Short signals following confirming the continuation of the down move!
Simple as that, if you are able to read the chart and not just following signals from an indicator.
Enjoy!

DOGEUSDT Ready for Pump(Soon again above 0.25$)We are looking for breakout to the upside and pump which hit targets like +20% -- +50% asap.
Price broke the major daily resistance like red trendline and now is getting ready for next phase pump this time hit targets like 0.25$ after more range here.
DISCLAIMER: ((trade based on your own decision))
<<press like👍 if you enjoy💚

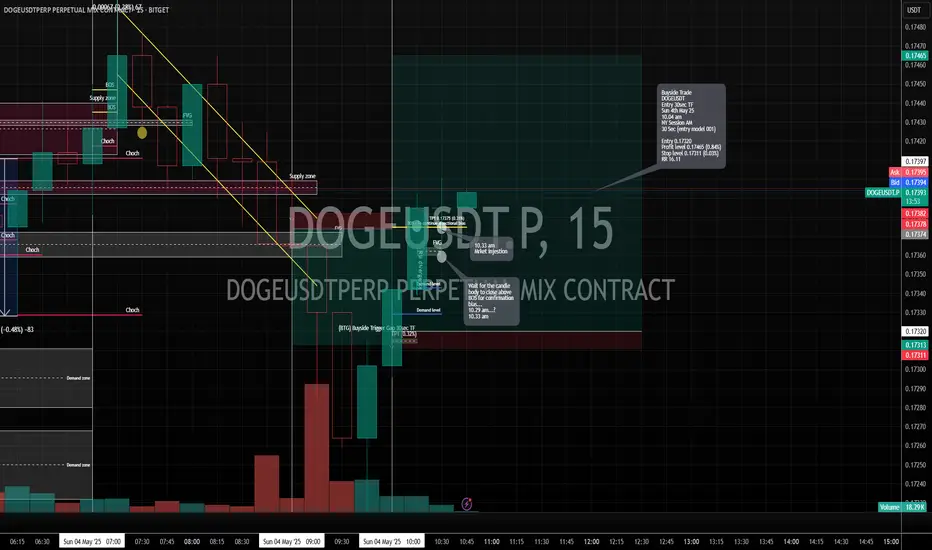
Long trade
15 TF overview
📘 Trade Journal Entry — DOGEUSDT (Buy Side)
🗓 Date: Sunday, 4th May 2025
⏰ Time: 10:04 AM
📍 Session: New York AM
⏱ Timeframe: 30-second chart
🪙 Pair: DOGE/USDT
📈 Direction: Long (Buy Side)
🎯 Entry Model: 001
🔹 Entry Details:
Entry Price: 0.17320
Take Profit: 0.17465 (+0.84%)
Stop Loss: 0.17311 (−0.03%)
Risk-Reward Ratio: 16.11
🔹 Trade Context:
Precision microstructure entry on the 30-second timeframe, aligned with entry model 001
Executed during the NY to LND transition when momentum builds and early positioning unfolds.
30sec TF observation
Short trade
15min TF overview
🔹 Trade Context:
📘 Trade Journal Entry — DOGEUSDT (Sell Side)
🗓 Date: Sunday, 4th May 2025
⏰ Time: 5:00 AM
📍 Session: Tokyo AM
🪙 Pair: DOGE/USDT
📉 Direction: Short (Sell Side)
🔹 Entry Details:
Entry Price: 0.17411
Take Profit: 0.17311 (−0.57%)
Stop Loss: 0.17445 (+0.20%)
Risk-Reward Ratio: 2.94
🔹 Trade Context:
A quick scalp opportunity, targeting a reaction from the local resistance zone. Executed during the Tokyo AM session, where liquidity often thins and price becomes vulnerable to stop runs and engineered sweeps.

DOGE WAKES UP?! The Dog Is Stretching… and It’s Not Just a Meme🐶💥 DOGE WAKES UP?! The Dog Is Stretching… and It’s Not Just a Meme Anymore 🐕🚀
BINANCE:DOGEUSDT – Daily Chart Breakdown
The dog has been sleeping… but every time it twitches, the market barks.
Now, Dogecoin is showing major RSI divergence + volume uptick — and that usually means one thing:
something’s coming 🧠📈
🧩 Technical Signals:
✅ Bullish RSI Divergence (momentum building while price dips)
✅ MACD Flipping Green
✅ Bouncing off long-term trendline support
🚀 Cup & Handle? Or Launchpad to $0.20?
Resistance to watch: $0.155
Breakout zone: $0.168
👁 Watchlist It. Chart It. Respect It.
You don’t want to be the last one to see the breakout candle.
“They laugh at Doge... until it moons again.” – Ancient Crypto Proverb 🌕
📢 Follow for more alpha and try the rsi_Miguel indicator to catch these setups early!
#DOGE #Dogecoin #CryptoCharts #Breakout #MemeCoinMagic #TradingView #RSIDivergence #ShibesAssemble


DOGECOIN BUY LIMIT...Hello friends✌
Given the good price growth and the arrival of buyers, now that the price is correcting, it is the best time to buy.
🙏If you like it, support it with a ✔like✔ and ✔comment✔.
*Trade safely with us*

Long trade
15min TF overview
🗓 Date: Saturday, 3rd May 2025
⏰ Time: 4:30 AM
🪙 Pair: DOGE/USDT
📈 Direction: Long (Buy Side)
🔹 Entry Details:
Entry Price: 0.17912
Take Profit: 0.17998
Stop Loss: 0.17901
Risk-Reward Ratio: 7.82
🔹 Trade Context:
Chart Timeframe: 15-Minute
Key Observations: Price filled a 1-minute Fair Value Gap (FVG) before moving up.
Trade positioned just above a key demand zone / FVG confluence.
The target is aligned near the prior session liquidity area.
1min TF entry

Dogeusdt is in Reversal Pattern Dogeusdt is showing reversal pattern on daily chart the RSI is showing bullish divergence and when the price will break the .206 level it will be a positive sign for bullish sentiment and it will go to test the daily trend line and after closing positive above the trend line it will likely to go in bullish trend again

Doge to 3 and above I'm not going to write much about it. Doge coin price will be around 3 to 4.5 USD before mid 2027 and here's the curve I've drawn.
Let's wait and see what happens.

Can we be optimistic that this will come true?( road to $1 )Perhaps this is a cup and handle pattern, and if that's the case, it could push the price up to around 90 cents.
Give me some energy !!
✨We spend hours finding potential opportunities and writing useful ideas, we would be happy if you support us.
Best regards CobraVanguard.💚
_ _ _ _ __ _ _ _ _ _ _ _ _ _ _ _ _ _ _ _ _ _ _ _ _ _ _ _ _ _ _ _
✅Thank you, and for more ideas, hit ❤️Like❤️ and 🌟Follow🌟!
⚠️Things can change...
The markets are always changing and even with all these signals, the market changes tend to be strong and fast!!

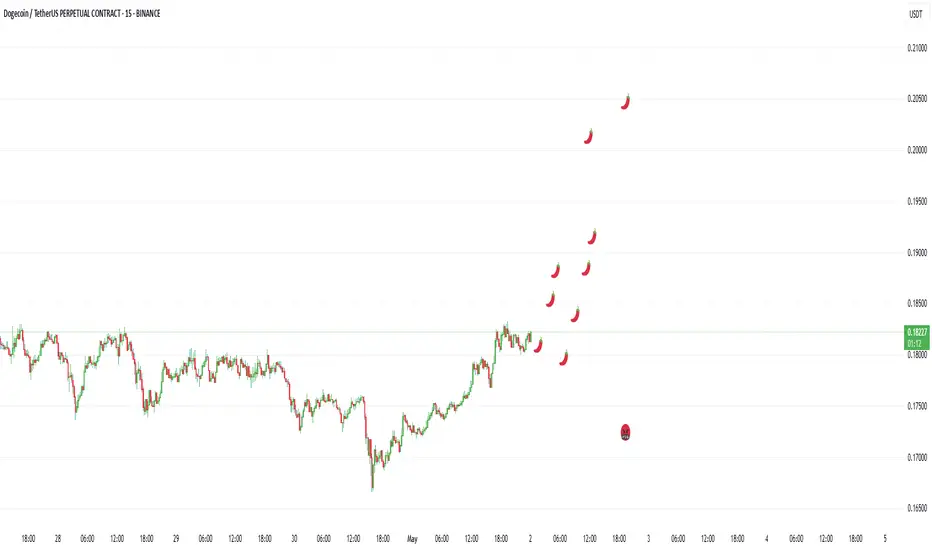
Doge chilliDoge chili peppers chart.
Try to connect as many as you can before it drops to the red face, if it ever does.
Who knows.

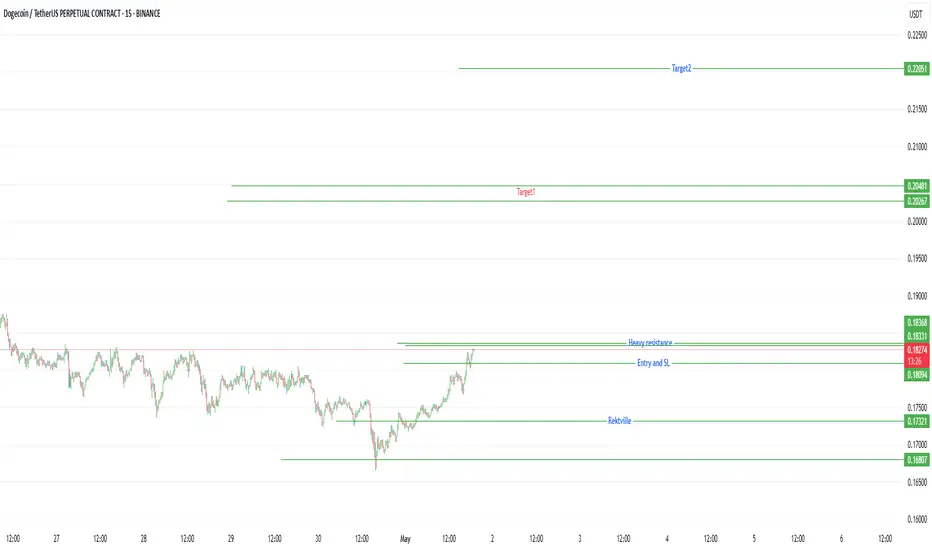
Doge chartDoge chart.
Key levels of support and resistance.
You want the price to stay above heavy resistance and use that as support before going bullish.
DOGE BUY SETUPCurrently on this Doge buy.
Monthly, weekly and daily are all bullish.
Plus BTC is also very bullish at the moment, so, i expect crypto to be bullish in the coming days.

Doge trading I deaHi traders opportunities does come n goo some won't tell you this but if you are looking for long term gains there is time to position yourselfs n time to hold only but when it explode you won't find any chance to enter because you have to enter low by the time everyone is scared of buying is your time to buy I only take snyper entries but you won't understand how get those entries,what am trying to say if you see opportunities like this use it in time don't waiste no time,your prayers is to manage to see the whole trend, approach it like this you already know what's going to happen now 100%,as a trader allow your mindset to expand n learn many things,I can advice you to buy this to 1$ if you can don't risk high but smart be blessed 😊

DOGE/USDT – 3D Long Signal Active📅 April 29, 2025
The system triggered a long entry at the last 3D bar close.
Currently, the price remains around the same levels.
✅ System conditions for a long are fully met:
MLR > SMA > BB Center > PSAR
Price is trading above the 200 MA on the 3D timeframe.
⚠️ Caution:
On the 1D timeframe, price is still below the 200 MA, which suggests some lingering weakness. Proceed carefully.
📍 Strategy Plan:
Consider entering long at today’s daily close or at the next 3D bar close.
Suggested stop-loss: below the latest PSAR dot for system integrity.
🔔 Keep an eye on updates and thank you for reading! 📈📊
