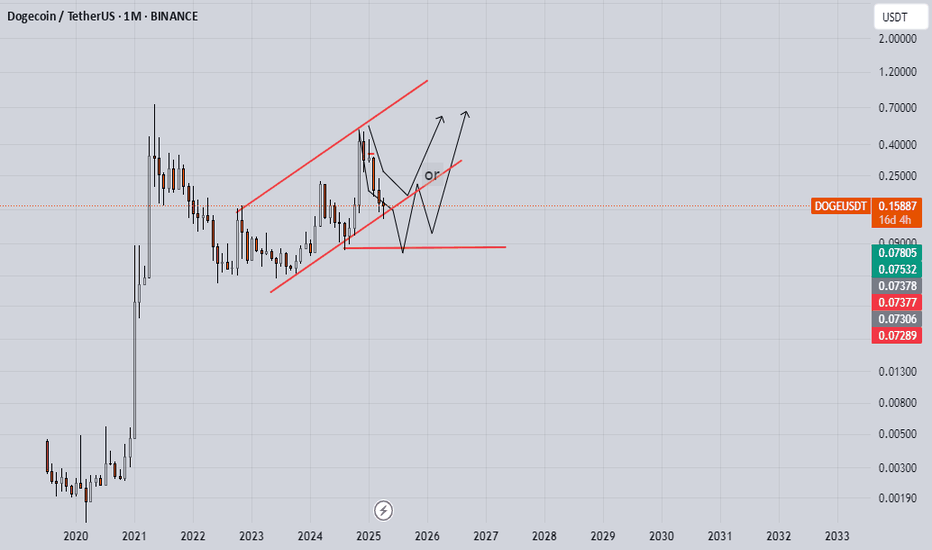
Dogecoin (DOGE): We Are Looking For Further Drop!Sellers have secured the lines of EMAs, where now we expect the price to drop even lower in order to establish some proper support zone.
As we are about to enter the weekend market, we might see some manipulations on the way, but the end game is the same.
We have set 2 possible scenarios for coin so let's see which way we will head from here.
Swallow Team
DOGEUSDT trade ideas
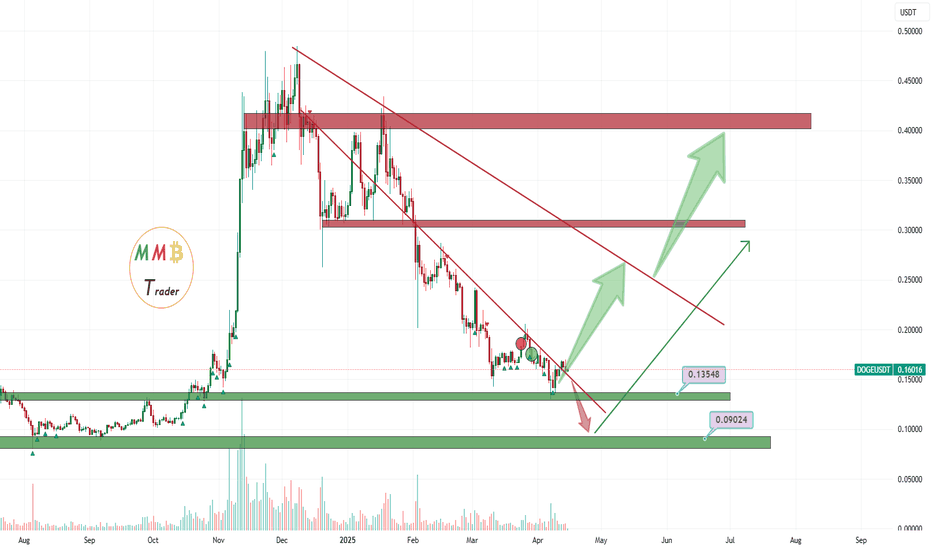
DOGEUSDT wait for rise and pumpPrice is near major daily supports like 0.13$ and 0.10$ supports and soon we are looking for huge rise here and after valid breakout to the upside from red trendlines market would be bullish once again for DOGEUSDT.
DISCLAIMER: ((trade based on your own decision))
<<press like👍 if you enjoy💚
#DOGE #DOGEUSD #DOGEUSDT #DOGECOIN #Analysis #Eddy#DOGE #DOGEUSD #DOGEUSDT #DOGECOIN #Analysis #Eddy
DOGEUSDT.P Higher Time Frame Analysis
(( First, I predict a 35% drop, and finally, from the lower green line, a 178% growth to the first target, and then a 364% pump to the second target. ))
Important areas of the higher time frame are identified and labled.
Everything is clear and I have clearly drawn the important areas in the chart and the labels and names of the areas are included. Depending on your analytical style, you can get the necessary confirmations and see the reduction from the marked areas to the specified targets.
This Analysis is based on a combination of different styles, including the volume style with the ict style.
Based on your strategy and style, get the necessary confirmations for this analysis to buy entery the trade.
Don't forget risk and capital management.
The responsibility for the transaction is yours and I have no responsibility for not observing your risk and capital management.
💬 Note : The price can go much higher than the first target, and there is a possibility of a 364% pump on this currency. By observing risk and capital management, obtaining the necessary approvals, and saving profits in the target, you can keep it for the pump.
Be successful and profitable.
Proceed according to my analysis on the Total 3 chart.
My analysis of the Total 3 chart :
👆 Based on the analysis provided on the Total 3 chart, proceed and wait for another bearish lag for the Total 3 chart to reach the specified area. The divergence on the upper timeframe is most likely a market maker trap and the current bullish move is a fake. In my opinion, the main bullish move will begin after another 30-45% correction on altcoins and the Total 3 chart reaching the specified area and the orange POC line.
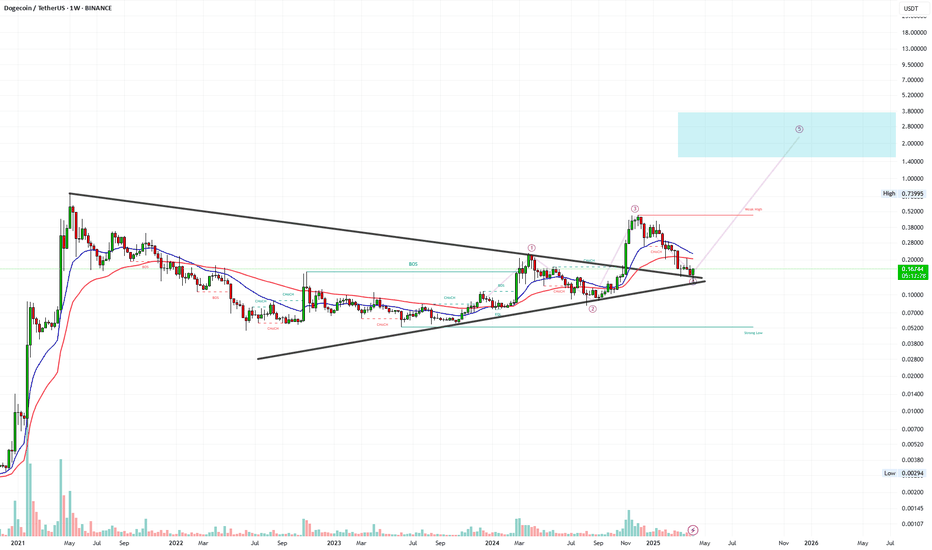
Dogecoin (DOGE) - 1WOn the weekly timeframe, Dogecoin (DOGE) formed a Symmetric Triangle and broke out bullish in November 2024. The breakout level, now support, was retested in April 2025. If this support holds, DOGE is likely to rally to a new all-time high, driven by community hype and market momentum. Failure to hold support could invalidate the breakout, risking a decline. Monitor the support zone and manage risks due to DOGE’s volatility.
DOGECOIN - Time to buy again!Perhaps this is a cup and handle pattern, and if that's the case, it could push the price up to around 90 cents.
Give me some energy !!
✨We spend hours finding potential opportunities and writing useful ideas, we would be happy if you support us.
Best regards CobraVanguard.💚
_ _ _ _ __ _ _ _ _ _ _ _ _ _ _ _ _ _ _ _ _ _ _ _ _ _ _ _ _ _ _ _
✅Thank you, and for more ideas, hit ❤️Like❤️ and 🌟Follow🌟!
⚠️Things can change...
The markets are always changing and even with all these signals, the market changes tend to be strong and fast!!
DOGEUSDT UPDATEDOGEUSDT is a cryptocurrency trading at $0.16485, with a target price of $0.30000. This represents a potential gain of over 90%. The technical pattern observed is a Bullish Falling Wedge, indicating a possible trend reversal. This pattern suggests that the downward trend may be coming to an end. A breakout from the wedge could lead to a significant upward movement in price. The Bullish Falling Wedge is a positive indicator, signaling a potential price surge. Investors are showing optimism about DOGEUSDT's future performance. The current price may present a buying opportunity. Reaching the target price would result in substantial returns for investors. DOGEUSDT is positioned for a potential breakout and significant gains.
DOGEUSDTmy entry on this trade idea is taken from a point of interest below an inducement (X).. I extended my stoploss area to cover for the whole swing as price can target the liquidity there before going as I anticipate.. just a trade idea, not financial advise
Entry; $0.13398
Take Profit; $0.15047
Stop Loss; $0.12881
The last bullish chance of doge in mid-term !!As you can see, the price has now formed an ascending wedge , which is promising. The price could rise to $0.27 after breaking this wedge...
Give me some energy !!
✨We spend hours finding potential opportunities and writing useful ideas, we would be happy if you support us.
Best regards CobraVanguard.💚
_ _ _ _ __ _ _ _ _ _ _ _ _ _ _ _ _ _ _ _ _ _ _ _ _ _ _ _ _ _ _ _
✅Thank you, and for more ideas, hit ❤️Like❤️ and 🌟Follow🌟!
⚠️Things can change...
The markets are always changing and even with all these signals, the market changes tend to be strong and fast!!
long at market 1st at 0.17268 2nd 0.2000Roll out,Confirmation are vwap postive
rsi postive
emas postive at lower tf
daily emas has to be retested
and we are way below volume weighted average price
i dont give calls on guesses slash predictions after 8-9 confirmations i publish an idea a call for community over n out to be honest i publish this to prove my skills accuracy 101 percent right and sl is 0.13124
DOGE → Will the market hold strength or lose it all?BINANCE:DOGEUSDT is testing the liquidity and resistance zone amid a downtrend as part of a news-induced rally. Will the market hold this trend or return to a sell-off?
The downtrend continues. As part of the correction triggered by the news backdrop, bitcoin strengthened and pulled the altcoins with it. But the market may lose all its growth quite quickly, as bearish pressure on the market is still very strong (There are no fundamental positive changes for the market). The fall of BTC may be followed by DOGE as well.
Technically, the price is forming a false break of the resistance zone 0.1622 - 0.15700, consolidation of the price below this zone will provoke the continuation of the fall to the nearest zone of interest 0.13646.
Resistance levels: 0.157, -0.1622
Support levels: 0.13646, 0.1277, 0.1154
A retest of the trend resistance is possible, but price consolidation below the key zone will be a good signal indicating the seller's strength, the decline may continue. On the weekly timeframe we have a trigger at 0.14217, break of which will open the way to 0.1277 - 0.1025.
Regards R. Linda!
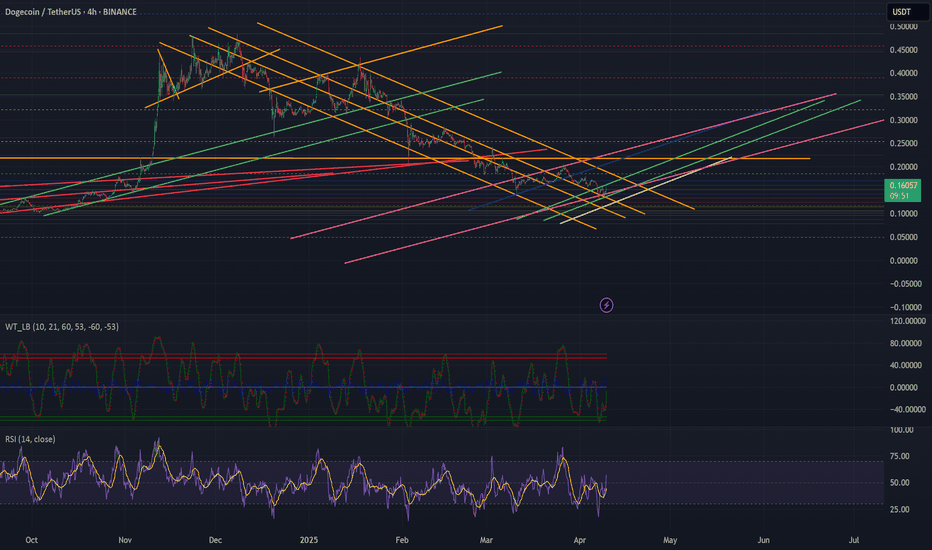
Doge 2hr from noob(just a 2hr chart nothing changed from my 4hr) so here is just a cont. from a prvious chart, horizon orange has been exttended, and the green risers have been added, the white and blue are my fiddle area zones of push favor, but again mostly just fiddling around with ideas, possible's. been watching for 2 years this is just a noob still. green horn, whatever, i dont care, its information for others as well as me seeing if i am catching the wave.
Doge 4hr from noobso here is just a cont. from a prvious chart, horizon orange has been exttended, and the green risers have been added, the white and blue are my fiddle area zones of push favor, but again mostly just fiddling around with ideas, possible's. been watching for 2 years this is just a noob still. green horn, whatever, i dont care, its information for others as well as me seeing if i am catching the wave.
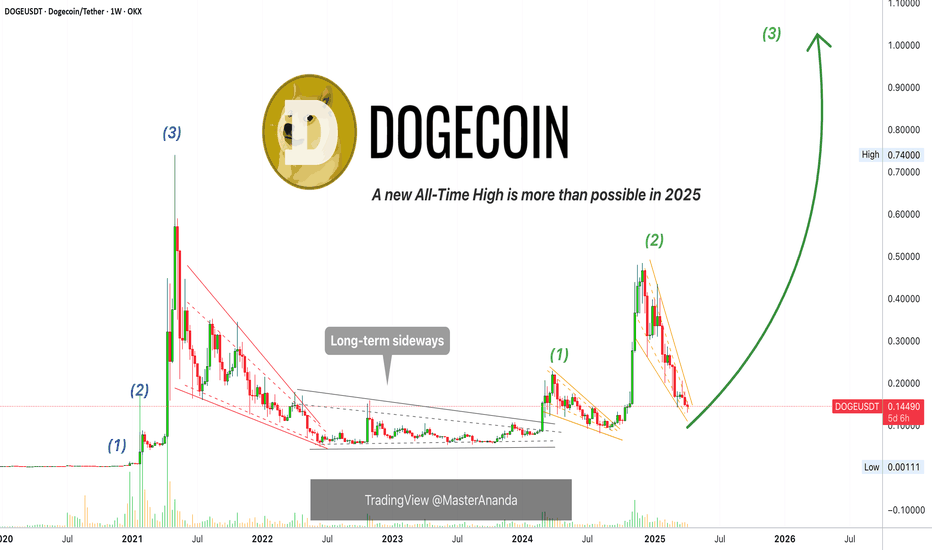
Dogecoin: Your Altcoin ChoiceYou can see it right? The first wave (1) is fairly small. The second wave (2), it goes higher. The third wave (3) will go much, much higher... I mean, it is easy to see as the same happened in 2021.
The '(3)' here is for illustration. I think the final price can go higher.
Ok, let's get into the analysis.
We are looking at Dogecoin based on the long-term.
Notice the left side, before the 2021 bull market there is a strong sideways period. The same is true between 2022 and 2024. So the dynamics are exactly the same. Only one thing is missing, the last wave which is the biggest wave.
It is so great to be alive today.
Let's say that sometimes we can disagree on our market views and the charts, but we can always agree about the overall market; Cryptocurrency is great. Cryptocurrency and being alive... Of course, sharing, work, family, friends and the rest. It is all amazing. What a wonderful opportunity we have here for those who love to trade.
No trading needed. No experience either, you can also just buy and hold.
Crypto can be your savings account, a savings account that grows. No overdraft fees, no hidden scam schemes taking your money away. You buy Cryptocurrency now and overtime value goes up. That's the truth based on past action. Where was this market 10 years ago?
Can you see? $100,000 USD in the bank in 10 years can be worth $1K.
$100,000 USD in Crypto in 10 years can be translated into the life that you deserve. A wealthy and healthy financial live. You will have to take care of the rest.
Our finances are only one aspect and to do good financially we have to take care of our hearts, mind and soul. If we can make money with Crypto, it will be easier to go through all the challenges that life throws at us.
What type of analysis are you looking for?
Yes! Dogecoin will grow.
The current drop is more steep than the previous one.
The current drop erased almost 100% of the previous bullish wave. This means that we are back to square one but with a higher low, a signal of strength.
Namaste.
DOGE: Position Trading Idea This is just an idea, Already excuted a buy order at @0.22 cents with 18% gains, and waiting to buy at the next zone @16 cents.
Please be carefull and dont be greedy, im optimistic for crypto in general, but in the short term i can see institutions and banks turning greed into fear and then will use same trick, drive the market with strong news and big decisions. so be boring like them and wait for the good discount.
If you have a different opinion please share it.
Thanks!
DOGEUSDT major daily supports are touching As we mentioned before two major daily supports like 0.13$ and 0.09$ can stop price from falling and we are now in support zones and soon heavy pump can lead once again like previous times.
DISCLAIMER: ((trade based on your own decision))
<<press like👍 if you enjoy💚
DOGE Weekly Chart: Retracement to Key Supply Zone in FocusCRYPTOCAP:DOGE is currently showing signs of potential retracement on the weekly chart, targeting a previous supply zone as a pivotal area for its next major move. This level aligns with a longer-term bullish outlook, presenting an opportunity for accumulation if the retracement holds.
The primary price target for this setup is $42.0, contingent on a confirmed bounce from the supply zone and sustained momentum. Traders should monitor volume and overall market sentiment as DOGE approaches this critical zone, as it could indicate the strength of a potential reversal or continuation. BINANCE:DOGEUSDT
Is DOGE About to Crash Hard From This Trap Zone? Read Before LONYello Paradisers — could this be the perfect bull trap setting up before a bigger drop? Our previous analyses warned about these kinds of setups, and once again, DOGEUSDT is flashing multiple signals that suggest a high-probability reversal could be just around the corner.
💎Currently, DOGEUSDT is trading right inside the golden Fibonacci retracement zone, a level that often acts as a powerful area of rejection. What makes this zone even more significant is the confluence of additional bearish indicators aligning at the same point. Both the 100 and 200 EMAs are present, reinforcing dynamic resistance, and there are clear Fair Value Gaps (FVGs) visible on both the 4H and Daily timeframes. On top of that, a bearish divergence has now formed, signaling early exhaustion in bullish momentum and further reinforcing the potential for a downside move.
💎When these elements align, the probability of a rejection increases substantially. However, we’re not jumping in blindly. If DOGEUSDT starts to bounce from here and shows weakness—such as stalling below resistance—then we’ll be closely watching for confirmation patterns like a double top or a head and shoulders. These would not only validate the bearish narrative but also offer significantly better risk-to-reward ratios for short setups.
💎That said, every setup has its invalidation. If price breaks and closes candle above our invalidation level, then the entire bearish scenario must be considered void. In that case, the best approach would be to stand aside and wait for a cleaner structure to form before taking any action. There’s no reason to force a position in uncertain conditions.
If you want to be consistently profitable, you need to be extremely patient and always wait only for the best, highest probability trading opportunities.
MyCryptoParadise
iFeel the success🌴

