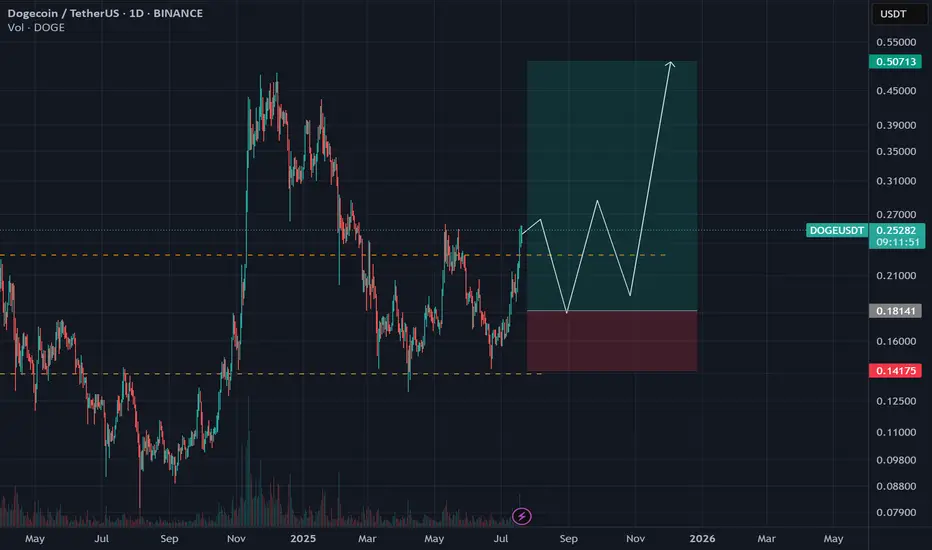
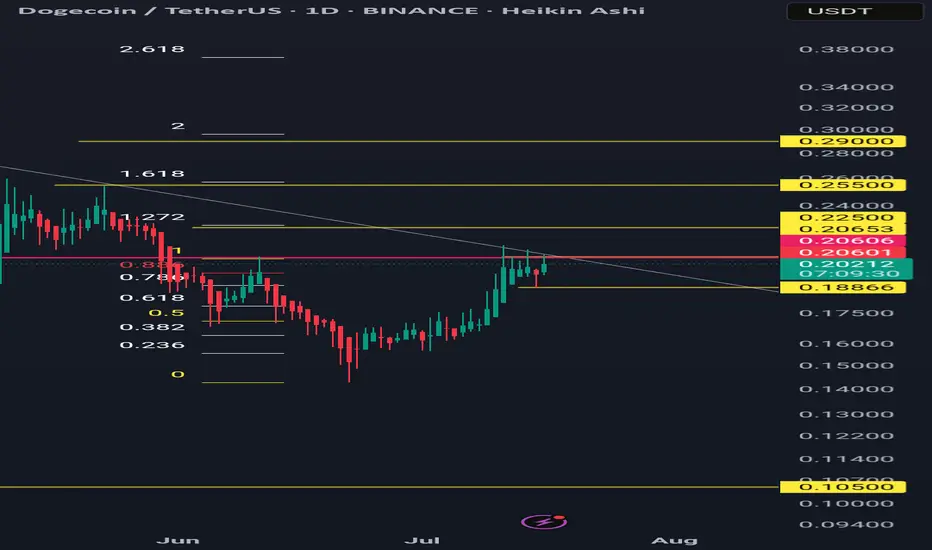
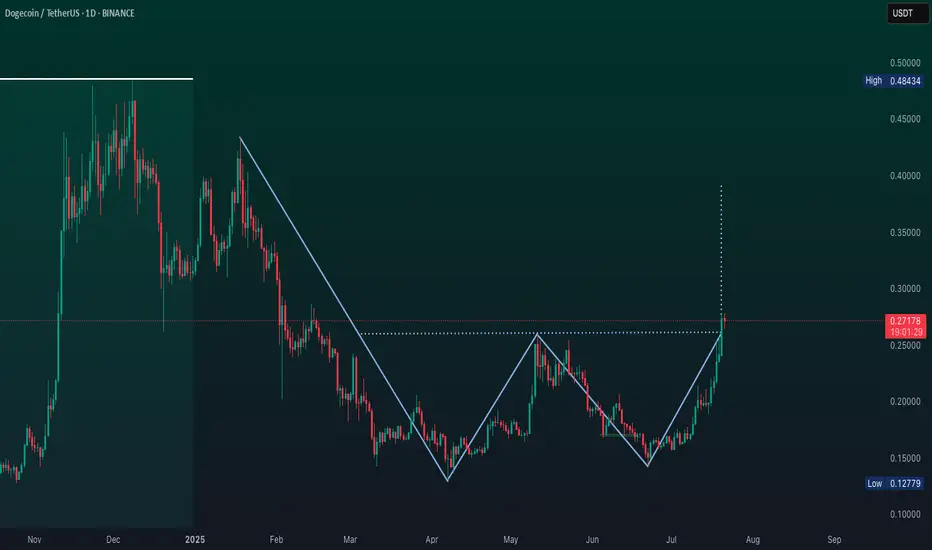
DOGE/USDT : eyes More Gains – Mid-Term Targets Up to $0.70! By analyzing the Dogecoin chart on the daily timeframe, we can see that since our last analysis around 7–8 months ago, the price started its rally from $0.10 and surged over 370% to reach $0.48. After that, it corrected back to around $0.13 and is currently trading near $0.27. If Dogecoin manages to hold above $0.25, we can expect further upside movement in the mid-term. The next targets are $0.287, $0.32, $0.41, and $0.70.
Please support me with your likes and comments to motivate me to share more analysis with you and share your opinion about the possible trend of this chart with me !
Best Regards , Arman Shaban
DOGEUSDT trade ideas

DOGE Breakout
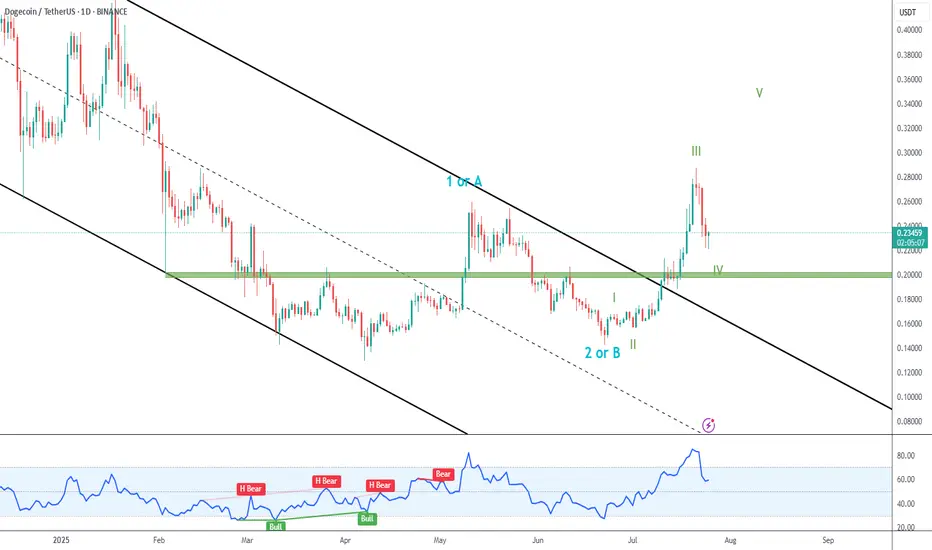
➡️ Dogecoin blasted away from the black descending channel and past green resistance (now support).
➡️ In my primary count, we are currently in green IV correction, and expect new higher highs.
➡️ A retest of green support would be nice, but it is probable that price won´t go that far.
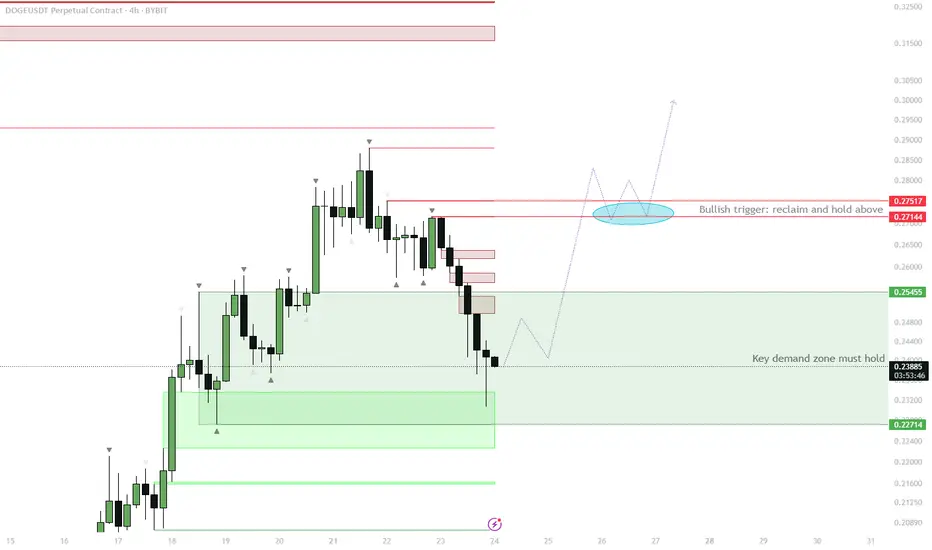
DOGE H4 – Demand Zone Reclaim as Bullish Trigger
Price is currently testing the H4 demand zone (~0.227–0.254).
Watch for price to reclaim the demand zone and close back above 0.254.
If confirmed, expect a move up toward the red resistance cluster at 0.271–0.275.
Consolidation above this area (highlighted in blue) would be a strong signal for continuation.
Invalidation: clean breakdown and acceptance below 0.227 signals failure of demand and deeper retrace.
This setup aims to capitalize on a classic liquidity sweep and demand reclaim. Typically, after taking out the flat open and collecting late shorts/stop losses, strong buying often steps in if demand is genuine. A successful reclaim and consolidation above the previous resistance will set the stage for bullish continuation. If this zone fails to hold, the move is invalidated and lower targets come into play. Waiting for confirmation reduces the risk of a failed bounce.
$DOGE Potential koreksi Analyst 🧠 Brief Analysis of the DOGE/USDT Chart (1H Timeframe)
1. Supply Zone Formed
Above is the SUPPLY area (around $0.2739), where sellers previously accelerated.
The price has rejected that area and is now starting to fall below the trendline → signaling buyer weakness.
2. Trendline Break = Potential Correction
The price has broken the ascending trendline → signaling an early reversal or at least a short-term correction.
3. Downward Targets
Target 1 = $0.2550 (mild demand zone)
Target 2 = $0.2440 (strong demand zone, likely solid support)
4. Stochastic Remains Neutral, Tends Down
Not yet overbought/oversold, but starting to form a subtle downward divergence = indicating further decline.

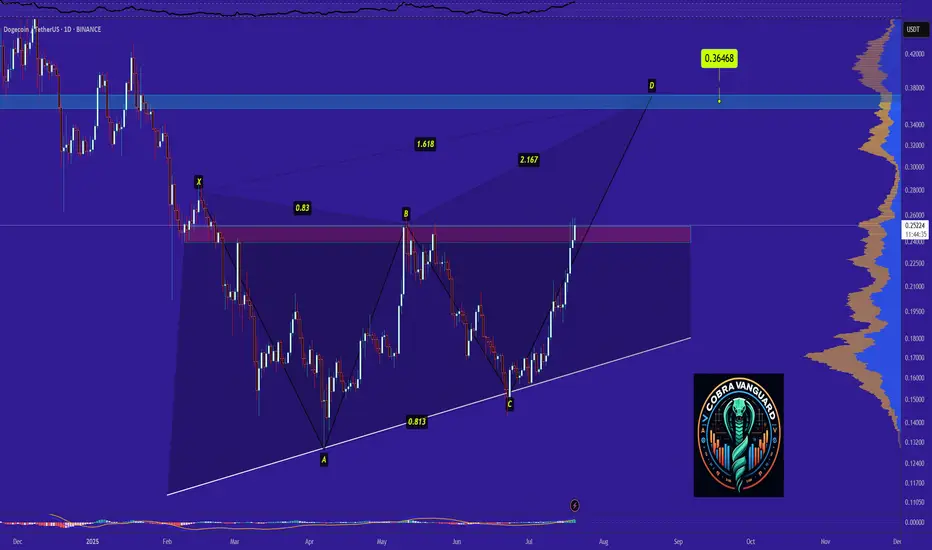
Dogecoin - Time to buy again!So if you pay attention to the DOGE chart you can see that the price has formed a Ascending Triangle which means it is expected to price move as equal as the measured price movement.( AB=CD )
NOTE: wait for break of the triangle .
Best regards CobraVanguard.💚
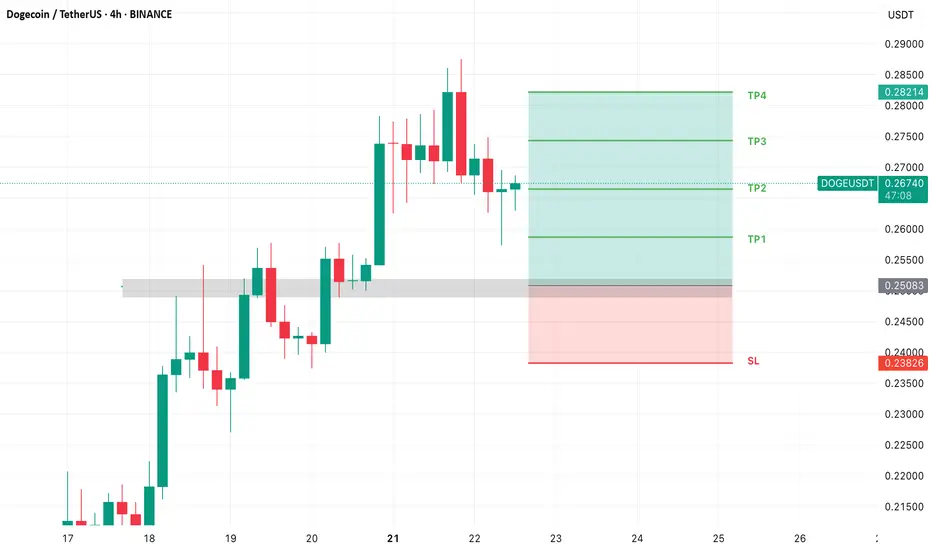
DOGE Swing Trade – Key Support in PlayDOGE is currently holding a major support zone, offering a strong risk-reward opportunity for a long swing position. With bullish sentiment and meme coin narratives returning, this level is worth watching for upside continuation.
📌 Trade Setup:
• Entry Zone: $0.23 – $0.24
• Take Profit Targets:
o 🥇 $0.27 – $0.28
o 🥈 $0.37 – $0.44
• Stop Loss: Just below $0.215

Dogecoin Wave Analysis – 25 July 2025
- Dogecoin reversed from resistance zone
- Likely to fall to support level 0.2000
Dogecoin cryptocurrency recently reversed down from the resistance zone between the key resistance level 0.2630 (former monthly low from December, acting as the resistance now), standing near the upper daily Bollinger Band.
This resistance zone wad further strengthened by the 38.2% Fibonacci correction of the previous sharp downward impulse from December.
Given the clear daily downtrend, Dogecoin cryptocurrency can be expected to fall to the next round support level 0.2000 (target price for the completion of the active correction ii).

DOGEUSDT at a Make-or-Break Level: Bounce or a Breakdown?📉 Overview:
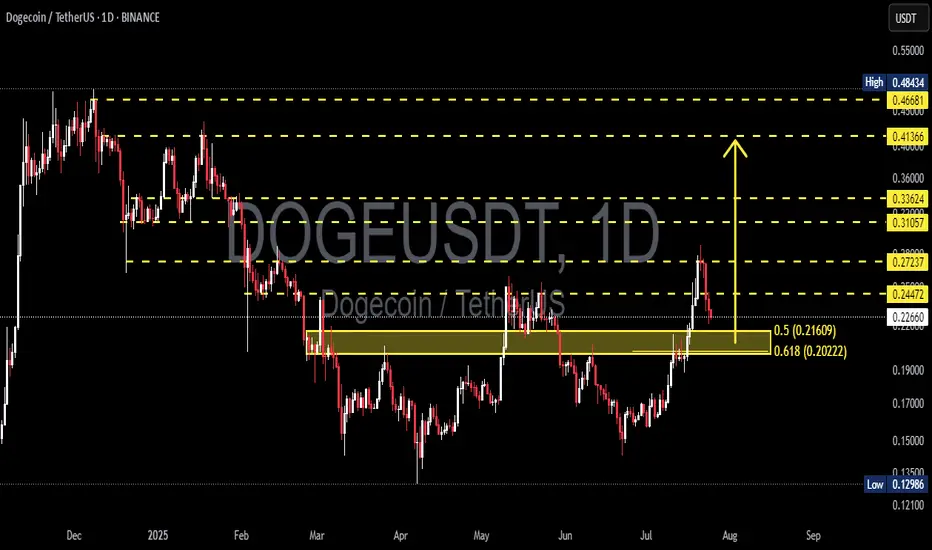
After a strong rally from the $0.13 zone to a recent local high of $0.272, DOGE is now undergoing a healthy correction. The price has retraced to a critical Fibonacci Golden Pocket zone (0.5–0.618) between $0.21609 and $0.20222 — historically one of the most powerful zones for market reactions.
This area also aligns with a previous resistance zone that is now being retested as support — a classic SR Flip (Support/Resistance Flip).
---
📌 Key Technical Structure:
🔸 Support & Demand Zone (Golden Pocket):
$0.21609 (Fib 0.5) and $0.20222 (Fib 0.618) – key retracement levels of the recent bullish swing.
Acts as a confluence zone with horizontal support from prior consolidation.
🔸 Major Resistance Levels:
$0.24472 – immediate resistance to reclaim.
$0.27237 – recent high and a major supply zone.
$0.31057, $0.33624 – historical distribution zones.
$0.41366 – breakout confirmation zone for a full trend reversal.
---
🧠 Market Psychology & Patterns:
Breakout & Retest: DOGE recently broke out from a long-term range and is now retesting the breakout zone.
Potential Bull Flag or Descending Channel: Current pullback resembles a flag or bull pennant — both continuation patterns if confirmed with volume.
---
✅ Bullish Scenario (Bounce):
If DOGE holds the Golden Pocket ($0.216–$0.202) and prints a strong bullish reversal candle:
A bounce may push price back to $0.244, and if reclaimed, back to $0.272.
A confirmed breakout above $0.272 with volume could lead to:
Mid-term targets: $0.310 → $0.336 → $0.413 → $0.466.
📈 Confirmation: Daily candle close above $0.244 with rising volume.
---
❌ Bearish Scenario (Breakdown):
If price fails to hold above $0.202 and breaks below with daily close:
It signals invalidation of the bullish structure and possible reversal.
Downside targets:
$0.186 – short-term support.
$0.150 – psychological support.
$0.129 – Year-to-date low (YTD Low).
This would also form a Lower High – Lower Low structure indicating a shift to a bearish trend.
---
🔍 Volume & Momentum Clues:
Watch for volume spikes near $0.202–$0.216.
Strong green candle + volume = likely reversal.
Weak reaction or breakdown on low volume = potential continuation downward.
---
🎯 Trader Playbook:
Signal Action Target
Bounce from $0.216–$0.202 Long Entry $0.244 – $0.272
Daily close below $0.202 Short / Avoid Longs $0.186 → $0.150
Breakout above $0.272 w/ volume Breakout Entry $0.31 → $0.336 → $0.41+
---
🏁 Conclusion:
DOGE is currently at a critical inflection point. The Golden Pocket zone will likely determine whether bulls are accumulating for another leg up or bears are about to reclaim control.
💡 This is a time for strategy, not prediction. Wait for confirmation before committing to either direction. The market is speaking — all we have to do is listen.
---
📊 Chart Summary:
Timeframe: Daily (1D)
Pattern: Breakout Retest + Fibonacci Retracement + Bull Flag
Structure: Higher High – looking for Higher Low confirmation
#DOGEUSDT #Dogecoin #CryptoTA #GoldenPocket #AltcoinAnalysis #FibonacciTrading #BreakoutSetup #BullishContinuation #BearishReversal

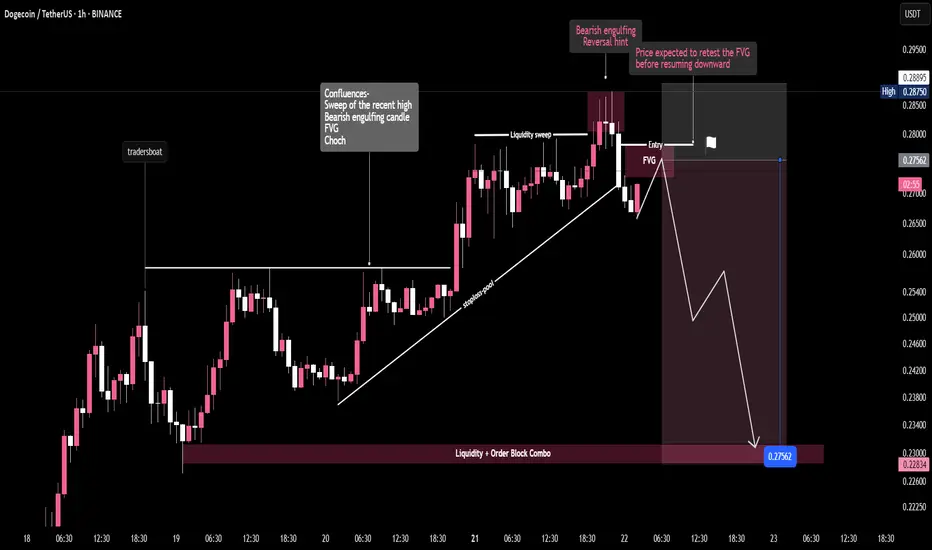
DOGE/USDT -1H "Dogecoin Fakeout? 🚨 Liquidity sweep followed by a bearish break – Smart money eyes the FVG for re-entry. Targeting the demand zone below. Patience is profit. 💰📉"
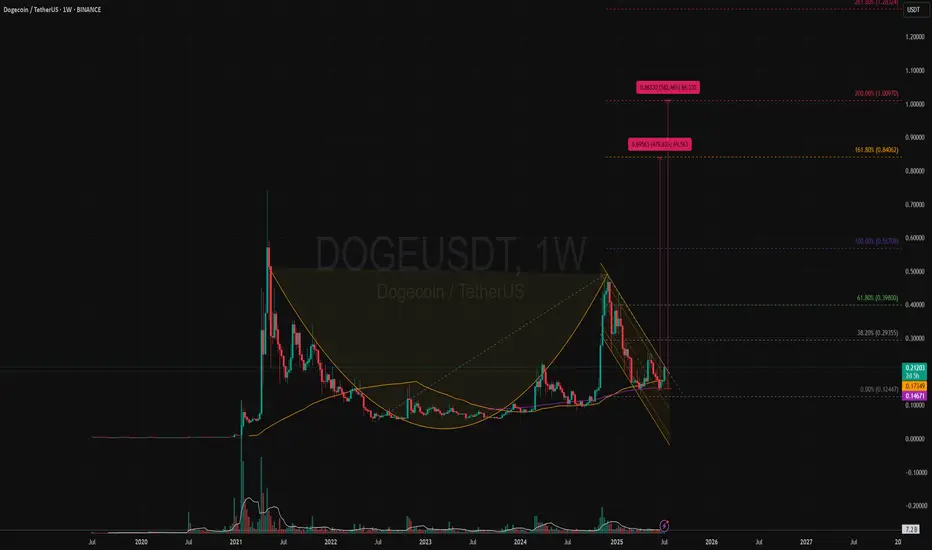
DOGEUSDT | Bullish Cup & Handle Revisiting Target +500% (1 USD)?Price Action and Chart Pattern Analysis:
DOGE cup bottom happened around $0.05 with the rim around $0.48. That gives a depth of roughly $0.42. If the breakout occurs near the rim, the measured move target would be $0.90 zone.
This aligns with several analyst projections suggesting DOGE could reach $0.90 to $1.00 if the breakout confirms.
Another way to project this cup & handle is the fibonacci-based target. These levels suggest that if DOGE breaks above the handle and sustains momentum, $0.85–$1.00 is a realistic zone for profit-taking at 161.8% and 200% extension as 1-2-3 wave pattern.
Reliability of the Cup and Handle Pattern for DOGE
The cup and handle is a classic bullish continuation pattern, but when applied to Dogecoin, its reliability depends on several dynamic factors:
Strengths of the Pattern in DOGE’s Context
Historical Accuracy: DOGE has previously respected technical patterns like rounded bottoms or (THE CUP) and breakout channels (THE HANDLE), especially during alt coin rallies.
Current Setup: a well-formed cup and handle on DOGE’s weekly chart, with price rebounding from $0.14 and testing resistance at $0.2 zone which also the key resistance SMA50W and the downtrend channel (the handle)
WATCH OUT: still a possible throw-under pattern or a final bear trap liquidity below previous low!
Key Action: If breakout confirmed with volume > Follow BUY | if not, wait for retraced SMA20 or breakout support.
Always trade with affordable risk and respect your stop...
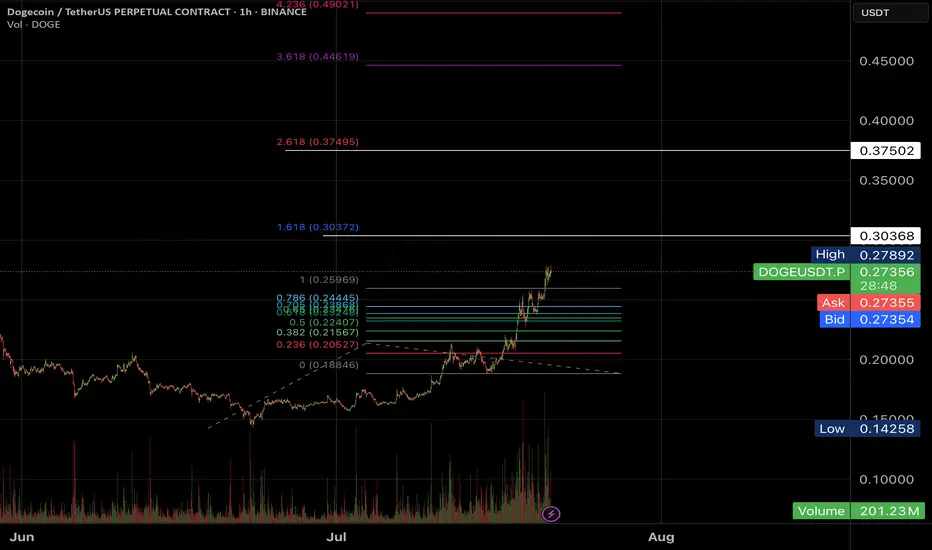
#DOGE/USDT falling wedge#DOGE
The price is moving within a descending channel on the 1-hour frame and is expected to break and continue upward.
We have a trend to stabilize above the 100 Moving Average once again.
We have a bearish trend on the RSI indicator, supporting the upward break.
We have a support area at the lower boundary of the channel at 0.22270, acting as strong support from which the price can rebound.
We have a major support area in green that pushed the price upward at 0.21777.
Entry price: 0.2320
First target: 0.24210
Second target: 0.25380
Third target: 0.26920
To manage risk, don't forget stop loss and capital management.
When you reach the first target, save some profits and then change the stop order to an entry order.
For inquiries, please comment.
Thank you.

Dogeusdt bullish iH&S/cup&handle pattern in daily tfForming a bullish pattern and a close above 0.206 in daily time frame may activate the pattern.
Targets are 0.225, 0.255 and 0.29
Invalidation below 0.1886
DOGE LONG TRADE SETUPDOGE/USDT is currently in a correction zone. There's a high chance it will retest the entry price before resuming its upward momentum.
DOGE Strategy — Momentum Entry, MA Trend Hold, Pullback PhaseThis chart showcases how the MACD Liquidity Tracker Strategy performed on DOGE over the past several days. The strategy entered during a clear momentum breakout and trended cleanly above its MA filter for nearly 48 hours.
Let’s break it down:
🔹 First Signal: Early compression breakout long, but price stayed flat. This entry was managed with a tight close before the second impulse began.
🔹 Second Long: Clean breakout on rising momentum — confirmed by MACD histogram expansion and strong Stoch RSI crossover.
🔹 Trend Structure: MA support held multiple times during this move, reinforcing the uptrend. Dotted trendline shows price respecting structure cleanly.
🔹 Exit Trigger: Price began consolidating and histogram showed waning momentum. The strategy correctly exited before the full reversal began.
🔹 Current Action: Pullback in progress. MACD histogram flipping red, Stoch RSI resetting. This may just be a correction… or the trend might be breaking.
📊 This setup is a textbook use of trend filters, confluence, and exit logic — and a good reminder that the strategy isn’t just about entry… it’s about managing exits with discipline.
Whether this develops into a higher low continuation or rolls into full reversal, momentum confirmation is key before the next entry.
#DOGE #TradingStrategy #AlgoTrading #MACDStrategy #QuantTrading #CryptoTechnicalAnalysis #PriceAction #TrendFollowing #Backtesting #CryptoCharts

#DOGEUSDT – Major Breakout Signals Strong Long-Term Momentum Dogecoin is showing significant bullish structure on the weekly timeframe, having broken out of a long-term descending trendline and reclaimed key horizontal support around $0.20–$0.22.
🔹 Key Technical Developments:
✅ Breakout above multi-month trendline resistance
✅ Retest and reclaim of major horizontal support zone
🔼 Price now forming higher highs and higher lows
📈 Path to next resistance zone: $0.48–$0.52
🎯 Long-term target zone: $0.75–$0.85
📌 Key Levels to Watch:
Support: $0.20 (horizontal) & uptrend line
Mid-Term Resistance: $0.48–$0.52
Long-Term Target: $0.75–$0.85
With weekly structure shifting bullish and trendline broken, DOGE could see a strong continuation if BTC remains stable. Ideal for swing/position traders.

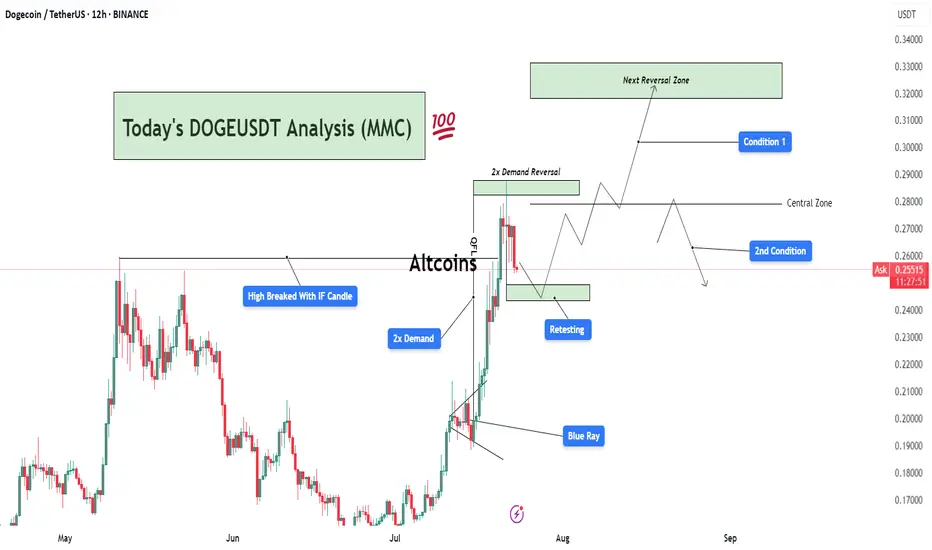
DOGEUSDT Analysis : Demand Zone Retest Before New Highs Target📊 Overview:
Today's DOGEUSDT analysis (12H chart) under the Mirror Market Concept (MMC) framework reveals a potential bullish continuation or corrective phase based on two major conditions. The market structure is transitioning after a strong impulsive move, triggered by a 2x Demand Zone breakout, and is now in the retesting phase.
🔍 Key Technical Breakdown:
High Broken with IF Candle:
A significant previous swing high was broken decisively by an Initiation Flow (IF) candle, indicating institutional activity or aggressive buying pressure.
This confirms a shift in market structure toward a bullish trend.
2x Demand Zone:
This zone has served as a strong base for price accumulation and an impulsive breakout.
The market responded well with a sharp rally post this demand, validating it as a critical support.
Blue Ray Zone (Support Zone):
The bullish breakout was partially driven by this inner trendline zone (referred to as Blue Ray), where price respected the rising support channel before breakout.
This shows smart money liquidity engineering prior to the breakout.
Retesting Zone:
Currently, the price is retracing toward a previously broken demand zone.
If this zone holds, it could provide an optimal entry for continuation.
📈 Two Scenarios (Conditions):
✅ Condition 1: Bullish Breakout to Next Reversal Zone
If the retest holds and price prints bullish confirmation (e.g., engulfing or pin bar), we can expect price to move up toward the next key reversal zone between $0.3100–$0.3300.
This zone is marked as a potential supply/reversal zone, where large sell-offs may occur.
This path follows the continuation structure under MMC, aligning with trend-following buyers.
⚠️ Condition 2: Failure to Hold Demand → Deeper Pullback
If the current demand zone fails to hold and price re-enters below the central zone (~$0.2700), we could expect a deeper correction.
Price may then revisit lower demand regions, potentially toward $0.2200 or lower, depending on rejection strength.
📌 Important Notes:
The central zone acts as a pivot level, defining whether bulls or bears gain short-term control.
Monitor the reaction from retesting area closely — candle confirmation is key before any trade execution.
This chart follows Mirror Market Concepts (MMC), combining smart money behavior, demand/supply reversal logic, and psychological market zones.
💬 Final Thoughts:
DOGEUSDT is currently in a critical phase. The market has shown strength, but now it's about confirmation. Patience is key — wait for a clean break or rejection around the retesting zone to determine the next direction. The analysis favors bullish continuation, but being flexible with both scenarios gives traders an edge.
DOGE – Strong Uptrend Confirmed by Aroon Indicator
DOGE is flashing a powerful bullish signal, with its Aroon Up indicator reading a perfect 100%. The Aroon indicator helps identify the strength and direction of a trend by tracking how recently price has made new highs or lows. A 100% Aroon Up reading means that the most recent highs are happening consistently within each period of the indicator’s lookback window.
Currently, DOGE is trading at price levels last seen in February, and the persistent new highs confirm a strong and steady uptrend. This setup suggests bullish momentum is not only intact but accelerating, as DOGE continues to push into higher territory with each candle.
Ask ChatGPT

Are you looking for a short in #DogeHi Padawans,
BTC.D is dropping from 66% to 60%, and as expected, ALTs are starting to pump.
I’m keeping an eye on DOGE and will look to take some quick short scalps once it reaches the target levels.
Best regards,
CryptoObi
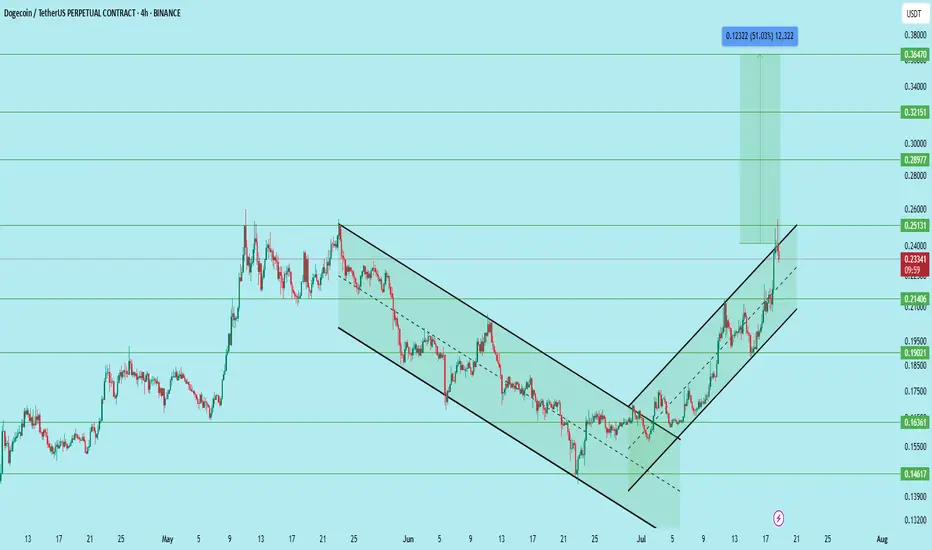
DOGE/USDT – Bullish Setup with Clear Channel BreakoutDogecoin has successfully broken out of a falling wedge and is now trending within a rising channel on the 4H timeframe. The price recently reclaimed the 0.214 support zone and is now showing continuation with strong volume and structure.
After the breakout and multiple retests, the pair offers a compelling long opportunity.
Setup Details:
Entry Zone: 0.208 to 0.214
Stop Loss: 0.186
Targets:
• 0.251 – First major resistance
• 0.289 – Mid-level breakout target
• 0.321 – Psychological round number
• 0.364 – Final target (approx. 51% move)
Technical Structure:
Breakout from falling wedge followed by bullish channel, Higher highs and higher lows clearly forming, Volume supports accumulation near breakout levels, Support holding above 0.214, confirming demand
Support Zones:
0.214 (reclaimed)
0.190 (intermediate)
0.163 (major demand zone)
Resistance Zones:
0.251
0.289
0.321
0.364
This setup offers a clean risk-reward ratio with confirmation on trend continuation. A rejection at 0.251 may present another opportunity to re-enter on a retest.
DYOR. Not financial advice.
DOGE daily timeframe updateOn-Demand Analysis: ❤️Like this post for more analysis!:
CRYPTOCAP:DOGE ’s surge combines a technical breakout, institutional validation, and sector rotation. While overbought signals suggest potential consolidation, the $0.25-$0.27 zone now acts as solid support
Support Zone: A strong base is at 0.2500-0.2700, where buyers might step in.
Resistance Level: The next big test is at 0.48434—break that, and it could climb higher!
Falling Wedge: This pattern, with its narrowing lines, often signals a bullish move if it breaks above 0.48434.
Momentum: The uptrend has steady volume, boosted by market activity.
Timeframe:Watch the next few days for the wedge to break out.
Possibilities:
Bullish Move: A jump above 0.48434 with good volume could push it to 0.5000 or more!
Bearish Drop: A fall below 0.2500 might take it back to 0.19621—stay careful!
Safety Tip: Set a stop-loss below 0.2500 to stay safe.
DOGEUSDT Technical Analysis - July 20, 2025DOGE appears bearish long-term (Dec 2024 ATH: $0.48), but recent price action reveals bullish divergence.
🔑 Key Observations:
1️⃣ April 2025 "Weak Support" ($0.15):
Low-volume consolidation → weak seller commitment.
Swift breakout confirms this was a liquidity grab by bulls.
2️⃣ Bullish Momentum Acceleration:
Minor resistance at $0.25 breached with 24% above-average volume (July 15).
RSI rising from neutral (58) → room for upside.
3️⃣ Declining Seller Liquidity:
Order book depth: Buy support at $0.23 is 3x stronger than sell pressure at $0.26.
Funding rates neutral → no overheated long squeeze risk.
🎯 Forward Outlook:
Short-term: Pullback to $0.27-$0.28 (liquidity sweep) likely before continuation.
Targets: $0.45 (pre-2024 resistance) → $0.50 (psychological level).
❗ Risk Management:
Invalidation: Daily close below $0.22.
Position Entry: Limit orders near $0.28 with 2:1 R/R.
📊 Chart Annotations:
Green zone: Optimal buy area ($0.27-$0.28)
Red line: Key invalidation ($0.22)
Blue arrow: Projected path