Dogecoin Weekly, Bullish Update —1,2,3,4,5 SequenceJust to make sure we have a little bit of everything, here we have Dogecoin sandwiched in-between EMA34 and MA200.
» XRP is trading above these two levels.
» ADA is trading below.
» ETH is trading above.
» BTC is mixed.
Seeing DOGE in-between can reveal a few things.
No drama, MA200 will hold.
MA200 sits at $0.13822.
Notice the drop between December 2024 and March 2025.
Big red candles; straight down.
Notice the more recent drop, between early May and early June.
Small candles and a curve is starting to show already.
What I am gathering from all these charts is that the retrace only has 1-2 weeks left. I say 1-3 weeks just to play it safe, but it seems to be almost over, the bearish action.
Look at this 1,2,3,4,5 sequence.
1) The last peak.
2) The main low.
3) Initial breakout.
4) Retrace and higher low.
5) The next peak.
We are currently at #4. This means that we are set to experience a new wave of growth, "the next peak."
Thanks a lot for your continued support.
Namaste.
DOGEUSDT trade ideas

You were warned. Now it’s runningThis was the second test into the FVG + 4H OB confluence. High volume candle. Wicking liquidity. And structure still intact.
Why I stayed calm:
Price didn't just drop — it delivered into a known rebalance zone. That 0.176–0.178 box was a magnet, not a mystery.
The reaction came right on cue:
Volume confirmed interest
Structure stayed intact
And the engine kicked in right after the sweep
Now? The play isn’t about guessing the top. It’s about knowing where price is drawn — and why.
Play-by-play logic:
4H OB provided the base
FVG gave the imbalance
Reaction zone created a clean entry
TP target? +18% mapped to 0.21
I didn’t enter on emotion. I positioned based on structure. That’s why it’s already moving while others still think it needs “confirmation.”
Final words:
“You don’t need hindsight when your foresight is built on logic.”

doge coin targetsBased on the blocks formed and the trend of Dogecoin. The trend of Dogecoin in the coming days and possible targets are shown in the image. Follow me to be informed of new analyses.

DogeHere is the possibility that i have drew up for the wave.
Horizontal ish dark and light green, buy marks/area
white is the gradual loop around rise
the light green up parrallel is boost growth.
i dont claim to know anything and am just seeing what i hit. along with sharing what my hailmary might be.

DOGEUSDT 1D AnalysisDOGE ~ 1D Analysis
#DOGE Buy back gradually from here with a short term target of at least 15%+, Long term target $0.5

Dogecoin, How Far Down Can It Go? Support Confirmed!The retrace is on and Dogecoin is moving lower with a full red candle. The trading day just started and this is truly concerning. As soon as I saw what was happening, bearish momentum growing, I wondered, will the last low (7-April) break or hold?
That's the question I will try to answer.
Since we already looked at the candles and chart structure (lower highs), I looked at the RSI to try and find some clues. Sure, the RSI is already bearish and became really weak 5-June. This is a positive signal because we are looking for signs of a reversal.
Once the RSI becomes weak it immediately starts to turn and the change happens first on the RSI and later the price. This is how you end up with a bullish or bearish divergence on the chart.
For the 7-April low to break, the RSI would have to go into extreme levels, ultra-weak/oversold, but this isn't likely, which means that there is a good chance that the 7-April low will hold.
A support zone is already being tested now which is the 0.618-0.786 Fib. retracement in relation to the April-May wave. While this is a weak support because it is based on the short-term, it is still a support zone and lots of bearish ammunition will be consumed here.
The 7-April low was a peak in September 2024 and also a bigger range from July 2024 (resistance turned support). In October 2024 this level was broken and tested one last time as support before the last bullish wave Dogecoin produced leading to a multi-year high.
In November 2024 again this level was tested on a wick and held nicely.
All in all, this means that we are likely to end with a higher low because this is a very strong support zone. I made it red on the chart.
If the action does move lower, it should only do so briefly on a candle wick. If you are lucky enough to be around when this takes place, you can go all-in at this point and you will be sitting on a great position for the next bullish wave.
Namaste.

$DOGE Inverse head & shoulder pattern formingWe can see that CRYPTOCAP:DOGE is currently forming an inverse h&s best visible on the 4 hour timeframe. If the local FVG manages to hold then we could see a nice push up to external liquidity.
Good luck traders!
Kieza Tradez

DOGE/USD 1H Short-term1. General situation on the chart
Trend: The last few dozen candles show a sideways movement with a stronger upward impulse, which was quickly corrected. We are currently seeing declines after the previous upward wave.
Current price: Approx. 0.1847 USDT.
Last structure: After the upward movement (peak around 0.205), the price dropped quite a bit, now consolidating below 0.19.
2. Formations and structures
Formation:
No clear classic formation (e.g. head-and-shoulders, triangle, flags) on the last candles.
However, something like a local peak ("double top") is visible around 0.203–0.205 — the price touched these areas twice and fell off, which suggests that this is a strong resistance.
Support and resistance:
Support: 0.1800–0.1820 — here is the last local low and the area where the price stopped before the previous upward movement.
Next support: 0.1740–0.1750 — the next low from the previous movements.
Resistance: 0.1900–0.1910 — here was the last consolidation, and then a sharp decline.
Strong resistance: 0.2030–0.2050 (recent highs).
3. Indicators
RSI:
RSI value close to 40 and is heading slightly down, but it is not oversold yet. This may suggest that there is potentially room for further decline.
MACD:
Histogram below the 0 line, MACD line below the signal, the bearish signal is still maintained.
4. Signals and potential scenarios
Base scenario (downside):
If the price breaks below 0.1820, the next target is around 0.1750.
Stop loss in this scenario: above the last resistance, e.g. 0.1910.
Alternative scenario (rebound):
If the price does not break 0.1820, and a demand reaction occurs - we may see an attempt to return to 0.1900, or even to the peaks in the area of 0.2000–0.2050.
Stop loss below 0.1800 (in the case of a long play).
5. Potential targets (by price action):
Short:
TP1: 0.1820 (nearest support, you can take some profit)
TP2: 0.1750 (next low, main target)
Long:
TP1: 0.1900 (nearest resistance)
TP2: 0.2000–0.2050 (highs, if the movement is strong)
Summary
Currently, the chart suggests a bearish scenario.
This is confirmed by the candlestick pattern, negative dynamics and indicators (RSI, MACD).
Key level to watch: 0.1820 – if it falls, we will probably go down to 0.1750.
If there is strong demand for 0.1820, a rebound to 0.19+ is possible.

DOGE 1D: Missed PEPE? Don’t Miss DOGE 06/12/25BINANCE:DOGEUSDT
I’m expecting a continuation of the upward movement and a possible trend reversal.
There’s a chance we’ll revisit the 0.618 Fib level to shake out weak hands — a classic move before liftoff.
Looking at the chart, it really feels like altseason is closer than anyone expects. DOGE may lead the charge.
Entry Points (EP):
• Market
• $0.19357
• $0.18009
Take Profit (TP):
• $0.22787
• $0.25439
⚠️ My personal opinion only — not financial advice.
Do your own research and remember: all actions you take are your own responsibility. Practice solid risk management and avoid investing more than 2% of your total capital per trade.
DYOR.

Waiting DOGE to hit ATHDoge is showing reversal signs. My first target is ATH (all-time high), which is just 163% away. The next goal is at least a 3x from there. Right now, we're in the weekly overbought zone (OB). If we break through it, the idea is invalidated.

DOGEUSDT Massive pump!!!As we can see market is in range zone now and price is still in descending channel and still receiving range and correction and kicking out the sellers.
But soon after breakout of channel uperside and above 0.25$ resistance price will pump hard and non stop to the targets mentioned on chart.
DISCLAIMER: ((trade based on your own decision))
<<press like👍 if you enjoy💚

doge buy long term "🌟 Welcome to Golden Candle! 🌟
We're a team of 📈 passionate traders 📉 who love sharing our 🔍 technical analysis insights 🔎 with the TradingView community. 🌎
Our goal is to provide 💡 valuable perspectives 💡 on market trends and patterns, but 🚫 please note that our analyses are not intended as buy or sell recommendations. 🚫
Instead, they reflect our own 💭 personal attitudes and thoughts. 💭
Follow along and 📚 learn 📚 from our analyses! 📊💡"

Dogecoin Bearish But...Yes, Dogecoin is bearish now but this is only a short-term situation, it is the end of a long-term correction. Notice the chart, Dogecoin has been producing lower highs long-term, since December 2024.
Recently, there was a major low in April and then a recovery and after this recovery we have local lower highs. The current drop is the continuation of the retrace that started 11-May. This retrace should end soon, within weeks or just a few days.
As soon as the low settles, we can enter the market bullish again. If you trade spot, simply wait. Day traders can easily SHORT but the range is short, after a small drop cover and switch back to LONG. Experts only.
That's the scenario. We are very likely to get a higher low compared to 7-April. If too many leveraged positions are open though and the market wants to remove those, there can be a long wick that pierces support for the action to recover the next day.
So, the drop can be fast, can be small, can be hard, can be easy or it can be short, it doesn't matter, once it is over, Dogecoin will continue to grow.
Patience is key.
Thanks a lot for your continued support.
Namaste.

Technical Analysis for Dogecoin (DOGE/USDT) – Daily Chart
🔍 Current Price Action:
Current Price: 0.19892 USDT
The price is reacting positively from a key support zone (highlighted with circles), indicating a strong bounce and potential for upward continuation.
📈 Target Resistance Levels:
0.20302 USDT – First short-term resistance, may be tested soon.
0.23355 USDT – Intermediate resistance; a key breakout level.
0.26690 USDT – Major resistance; target if momentum remains strong.
🧠 Technical Insights:
Pattern Observation: A double bottom-type reaction from support suggests bullish reversal.
Projected Gray Candles: Show a potential bullish scenario toward the next resistances.
Trend Outlook: Bullish bias remains as long as the price holds above the 0.185 area.
✅ Strategy Suggestion:
Entry Zone: Between 0.195 – 0.200 USDT (after confirmation of support hold)
Take Profits:
Target 1: 0.203
Target 2: 0.233
Target 3: 0.266
Stop Loss: Below 0.180 (to protect against failed support)
📌 Summary:
A strong bounce from a confirmed support zone gives DOGE potential for a continued rally toward 0.23–0.26 if the current momentum is maintained.

Dogecoin (DOGE): Getting Ready For Buyside Movement | $0.44Dogecoin is repeating its pattern where, after forming local lows and the first breakout above EMAs, the price is not getting ready for a proper push, it seems to us.
We are monitoring for the EMA line here, as once we see a proper break (the second one), we will be aiming for the $0.44 area.
Swallow Academy

DOGEUSDT BINANCE:DOGEUSDT Price is ranging between 0.18200 and 0.18650 dollars after a sharp rise from 0.17000. A break above 0.186 triggers a buy, targeting 0.19450 and 0.19950 dollars. A break below 0.182 triggers a sell, with supports at 0.17650 and 0.17000 dollars.
Trigger Levels:
Buy Trigger: 0.186
Sell Trigger: 0.182
⚠️Contorl Risk management for trades.

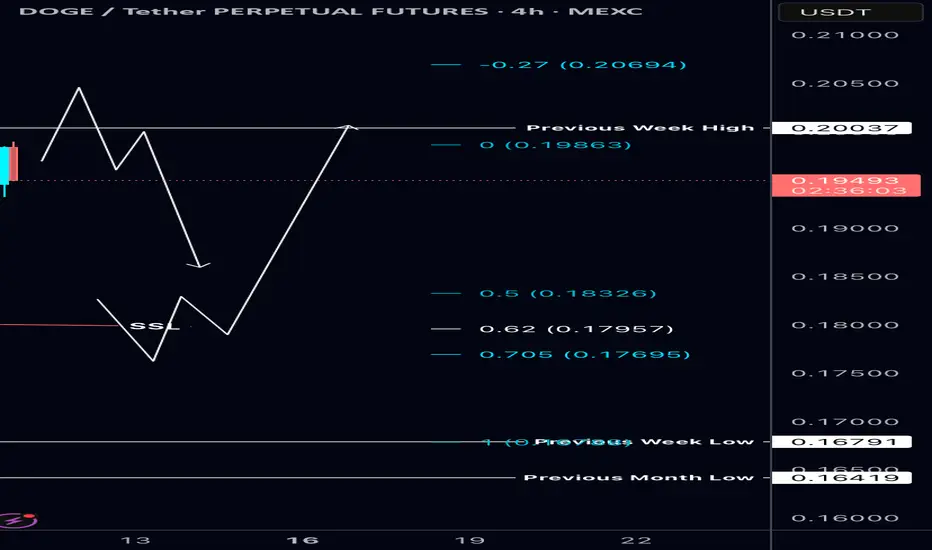
$DOGE Analysis 📊 CRYPTOCAP:DOGE Analysis 📊
🚀 #DOGE bouncing strong after a clean retest of the Daily +OB, now hovering near the POC zone.
🔴 Waiting for a sweep of PWH to consider a short — if price rejects earlier, I’ll watch for that small SSL to get tapped along with OTE for a long setup.
Doge bearish in 1hr time frameThe pattern is not yet complete, but if it makes a new bounce and retests again, it will attract bearish traders, increasing the likelihood of a breakdown. A close below 0.1865 on the 1-hour timeframe will confirm the pattern. This level also serves as the invalidation point for long entries and the final take-profit (TP) from the previous bearish pattern.
Targets are 0.174 and 0.167.

Doge Double Trouble $0.22 or $0.17 NextTwofer Doge . 10-15% move either way likely based on how bitcoin does.
Breakout
0.224
Breakdown
0.172
Decided to throw this chart together based on my original idea of the end to end cloud touch that is working out well.

Doge Rocket End to End Cloud MoveThe idea basis is simple.
1) Full M pattern target did not fully hit, look for resistance that can send it lower to complete it.
2) Found the Daily Cloud End to End Move where we go to the very top and reject straight back down to fill out the M
We also have an inverse h&S showing 0.207 target
Good Luck

Everything Looks Fine Until You're Liquidated Ever felt like the market is calm and steady, then boom — everything crashes?
Everything seems fine … until one liquidation candle slaps you awake.
This analysis explores how the illusion of safety can destroy your capital — and how to use TradingView tools to stay ahead.
Hello✌
Spend 3 minutes ⏰ reading this educational material.
🎯 Analytical Insight on Dogecoin:
If Dogecoin fails to gain at least 30% in the next two weeks—while Bitcoin continues to rally—this divergence could signal a broader market weakness. When BTC outperforms and altcoins lag, it often reflects declining risk appetite and potential capital rotation out of speculative assets. A move toward the $0.25 target is key for confirming bullish continuation across the altcoin sector. 📉
Now , let's dive into the educational section,
🧠 The Illusion of Safety: Silent Capital Killers
The biggest risk in trading is when things “seem fine.” A quiet chart is often the calm before the liquidation storm. Don't get cozy.
📍 TradingView Tools That Could Save You 🛠️
When the market feels safe, that’s exactly when danger starts brewing.
This is where TradingView’s tools come into play as your best defense.
First up: Volume Profile V isible Range. It reveals exactly where big players entered and where liquidity is building up.
Right near these zones, you’ll often find fake breakouts and whale traps.
Next: Fixed Range Volume Profile — great for identifying volume clusters within specific price ranges. If volatility shrinks while nearing a high-volume zone, get ready: a shakeout may be coming.
Don't just use price alerts. Go deeper — set alerts for EMA crossovers, sudden RSI shifts, or breaks through low-volume areas . That’s where silent moves become violent moves.
One underrated gem: Long/Short Position Tool . Use it to simulate your liquidation points before you open a trade. It’s like pre-visualizing your own death — so you can avoid it.
These tools aren’t just fancy widgets. They’re how you read the silent signals of the market before it slaps.
🐍 Whales Hunt Your Comfort Zone
The market doesn’t wait for you to be ready. Whales wait until you feel safe. Then they hit, wiping retail traders to create room for entry.
🚩 Trades Without a Plan Are Liquidation Invitations
Opening a position without mapping your liquidation zone? That’s like flying blind into a hurricane. Always have Plan A — and a backup Plan B.
🔍 Quiet Crashes Begin With Fake Breakouts
The market won’t warn you. It teases with one green candle, maybe a soft pump... and then drops like a rock. That’s the trick.
🧮 Moving Averages: When Smooth Means Scary
When EMA 21 and 55 flatten out too much, it’s not peace — it’s buildup. Flat EMAs = warning. Don’t be fooled by “smooth” charts.
⚠️ Liquidation Data = Psychological Red Flag
Liquidation spikes on sites like Coinglass aren’t just stats — they’re signs of herd slaughter. Use them as sentiment analysis. It's not just what got liquidated — it's who and why.
🧪 Post-Liquidation Analysis: Recovery or Spiral?
After liquidation, many rush to “make it back.” That's when more destruction happens. You need a post-liquidation plan, not just a pre-trade strategy.
🔐 The Best Trades Are Sometimes Early Exits
Exiting a trade that looks “fine” is a pro move. When everything feels stable, the market may be prepping to flip the table.
🧊 Cold-Minded Trading Saves Accounts
Pros stay ready during calm markets. Amateurs dive in when it’s “finally safe.” That mindset difference defines survival.
🧭 Final Takeaway
If there’s one thing to remember from this analysis, it’s this:
Never trust the market. Trust your tools. Trust your strategy.
The market is never safe — it only pretends to be.
✨ Need a little love!
We put so much love and time into bringing you useful content & your support truly keeps us going. don’t be shy—drop a comment below. We’d love to hear from you! 💛
Big thanks,
Mad Whale 🐋
📜Please remember to do your own research before making any investment decisions. Also, don’t forget to check the disclaimer at the bottom of each post for more details.

DOGE | BULLISH Pattern | +100%DOGE is seemingly ready for more upside as we start to see a pattern resembling an inverse head and shoulders pattern:
✅Usually, the Inverse H&S plays out something like this:
📢But the pattern is not quite confirmed just yet. We'd need to see a close ABOVE the current resistance zone to validate the pattern:
If we can see that, it's likely that there can be BIG gains on DOGE. It will especially help if ETH makes more increases, showing that the general alt market is heading in the right direction.
____________________
BINANCE:DOGEUSDT

Doge(based on NEowave)like ETH wave E is ending and soon it will start a huge bullish wave.
wave E look likes a bow-tie diametrical and wave g is at the end which is the last chance to buy.
