Important Support and Resistance Zone: 0.31600-0.33591
Hello, traders.
If you "Follow", you can always get new information quickly.
Please click "Boost".
Have a nice day today.
-------------------------------------
In order to reduce the auxiliary indicators to one, StochRSI indicator has been added to BW v3.0 indicator.
--------------------------
The 0.31600-0.33591 zone is an important support and resistance zone.
It is becoming more important because the M-Signal indicator on the 1W chart is rising nearby.
In order to turn into a short-term uptrend, the MS-Signal (M-Signal on the 1D chart) indicator must rise above and maintain the price.
Therefore, support around 0.37778 is important.
-
Since the StochRSI indicator is showing a change in slope in the oversold zone, if it shows support around 0.31600-0.33591, it is a time to buy.
If it rises,
1st: 0.37778-0.39641
2nd: 0.42847
You should consider whether to respond depending on whether there is support around the 1st and 2nd above.
If it is supported around 0.42847 and rises, it is expected to start rising to the Fibonacci ratio point of 2.618 (0.61238).
-
For this movement to actually occur, USDT and USDC must maintain a gap uptrend.
In addition, BTC dominance or USDT dominance must show a downtrend.
-----------------------------
The most important element in creating a trading strategy is the support and resistance points drawn on the 1M, 1W, and 1D charts.
To do this, you need to understand the arrangement of candles.
When studying charts, it is important to read them repeatedly.
Since we are not studying to become chart analysts, we do not need to memorize various names or patterns.
It is more important to understand what kind of flow is being talked about.
-
The next important thing is the price moving average line.
When studying charts, you will realize that the most important thing in a chart is the average value.
Therefore, you will realize that all indicators express how to return to the average value.
Therefore, it is more important to understand how to interpret the price moving average line than to study complex indicators.
Goodbye, complex indicators!!!
-
If you look at the chart in that sense, you will understand why.
1. M-Signal indicator (MS-Signal indicator) on 1M, 1W, 1D charts indicating trends
2. HA-Low, HA-High indicators for creating trading strategies
3. BW(0), BW(100) indicators for detailed responses
I drew horizontal lines on 1M, 1W, 1D charts to indicate support and resistance points.
The remaining indicators are created for chart analysis, so they are not actually necessary when conducting trading.
You can draw Fibonacci ratios and use them as support and resistance points, but you should not forget that Fibonacci ratios are drawn for chart analysis.
Do not use Fibonacci ratios for the purpose of conducting trading.
-
Thank you for reading to the end.
I wish you successful trading.
--------------------------------------------------
- Big picture
I used TradingView's INDEX chart to check the entire range of BTC.
(BTCUSD 12M chart)
Looking at the big picture, it seems to have been following a pattern since 2015.
In other words, it is a pattern that maintains a 3-year bull market and faces a 1-year bear market.
Accordingly, the bull market is expected to continue until 2025.
-
(LOG chart)
Looking at the LOG chart, we can see that the increase is decreasing.
Accordingly, the 46K-48K range is expected to be a very important support and resistance range from a long-term perspective.
Therefore, we do not expect to see prices below 44K-48K in the future.
-
The Fibonacci ratio on the left is the Fibonacci ratio of the uptrend that started in 2015.
That is, the Fibonacci ratio of the first wave of the uptrend.
The Fibonacci ratio on the right is the Fibonacci ratio of the uptrend that started in 2019.
Therefore, this Fibonacci ratio is expected to be used until 2026.
-
No matter what anyone says, the chart has already been created and is already moving.
It is up to you how to view and respond to it.
Since there is no support or resistance point when the ATH is updated, the Fibonacci ratio can be appropriately utilized.
However, although the Fibonacci ratio is useful for chart analysis, it is ambiguous to use it as a support and resistance role.
The reason is that the user must directly select the important selection points required to create the Fibonacci.
Therefore, it can be useful for chart analysis because it is expressed differently depending on how the user specifies the selection point, but it can be seen as ambiguous for use in trading strategies.
1st: 44234.54
2nd: 61383.23
3rd: 89126.41
101875.70-106275.10 (when overshooting)
4th: 134018.28
151166.97-157451.83 (when overshooting)
5th: 178910.15
-----------------
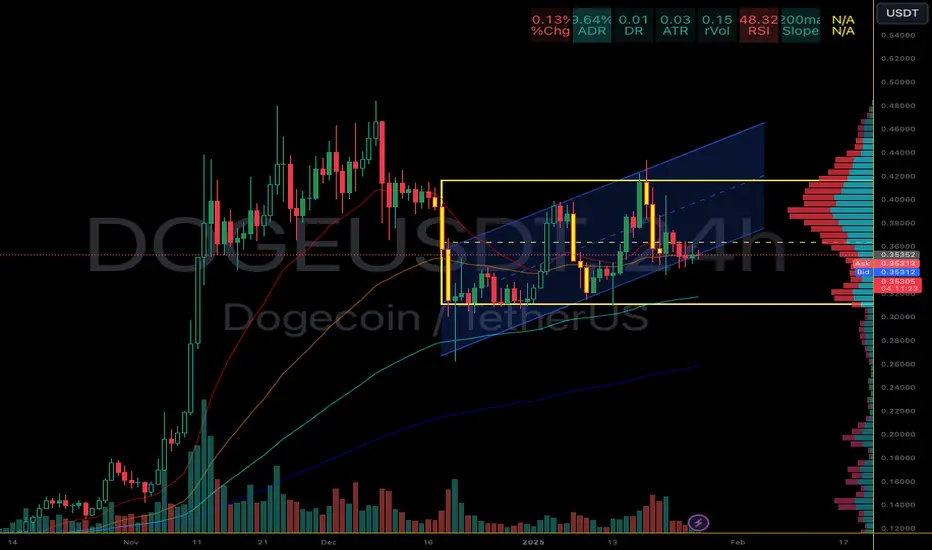
DOGEUSDT_023B62 trade ideas

DogecoinDoge usdt Daily analysis
Time frame 4hours
Risk rewards ratio >2
Dogecoin always has a good volume in the market
Investors know that Musk is interested in Dogecoin, and this is a positive point for this currency. The currency was created as a joke but found its place and now Doge has drawn a clear path for itself and for enthusiasts.
The price is now fluctuating in an ascending triangle. It's very dangerous if market crashed down but I think sentiment of market is positive after Trump.
Of course we must be careful
So my target is not dreamy
I am watching the market and waiting for suitable time to enter again for higher target on 0.73 $

for better understanding just write me.DogeUSdT is looking pretty bullish on lower and medium time frames. like the 5m,3m,15m and the 30m.


Dogeusdt BullishDogecoin bullish outloock, we can identify strong bullish entry at 0.3180 level. If price breaks this zone than bears target will be 0.24 zone but hope this doesn't happen.

Is Dogecoin at risk of being replaced by Musk-themed coins?Hello and greetings to all the crypto enthusiasts, ✌
Reading this educational material will require approximately 10 minutes of your time . For your convenience, I have summarized the key points in 10 concise lines at the end . I trust this information will prove to be insightful and valuable in enhancing your understanding of Dogecoin and its role in the global financial landscape.
Dogecoin has gained significant prominence in Elon Musk's business ecosystem, thanks to its widespread use in Musk-associated ventures and Musk's personal advocacy. His vocal support has propelled Dogecoin into the mainstream, cementing his position as one of the most influential figures in the cryptocurrency space. While Musk has previously commented on Bitcoin, it was his involvement with Dogecoin that truly bridged the gap between the business world and cryptocurrency, making Dogecoin the first cryptocurrency to connect him to the broader crypto universe.
Given Musk's continued backing, it is unlikely that Dogecoin will face a sharp decline in the near future. Instead, it is poised to benefit from Musk’s influence and growing presence in the crypto space. However, the dynamic nature of the cryptocurrency market means new competitors could emerge, potentially impacting Dogecoin's market share. For example, projects like Floki have quickly risen by leveraging high-profile personalities and branding, which could inspire other cryptocurrencies to challenge Dogecoin’s dominance.
Musk’s upcoming ventures, such as XMoney—a blockchain-powered payment platform for his companies like Tesla and SpaceX—could increase demand for Dogecoin. This platform will provide a decentralized payment infrastructure across Musk’s businesses, potentially further solidifying Dogecoin's place in his ecosystem. While the full impact of these developments is still unclear, Musk's leadership in integrating cryptocurrency into established industries is likely to continue.
Another notable factor is Musk's connection with former President Donald Trump, whose recent engagement with the cryptocurrency market has added further attention to the sector. This intersection between high-profile figures has sparked fresh interest in digital assets, creating upward momentum for Dogecoin and other related assets. This growing attention could drive Dogecoin’s price higher as the market responds to this renewed liquidity.
On the technical side , indicators for Dogecoin are increasingly positive. Analysts suggest it may soon break out of its current price channel, signaling the potential for a significant price surge. If Dogecoin can surpass key resistance levels, a bullish phase could emerge, leading to notable price increases in the short-to-medium term. This potential breakout is supported by Musk's ongoing influence in both the tech and crypto spaces, which tends to have a substantial impact on market sentiment.
The broader cryptocurrency landscape is also contributing to Dogecoin's promising future. Trends such as blockchain technology development, institutional adoption of cryptocurrencies, and growing recognition of crypto as a legitimate asset class suggest that Dogecoin will remain a significant player in the market. As the cryptocurrency market evolves alongside technological and regulatory changes, Dogecoin’s relevance appears likely to endure.
Furthermore , the rise of artificial intelligence (AI) in the crypto space could shape Dogecoin's future. As AI technologies continue to advance, they will influence cryptocurrency trading, market dynamics, and risk management systems. Musk’s involvement in both AI and crypto may provide opportunities to leverage AI-driven tools to enhance Dogecoin's appeal and utility, making it more accessible and efficient for users, which could boost mainstream adoption.
Lastly , the regulatory environment around cryptocurrencies will play a crucial role in determining the future of assets like Dogecoin. While regulations remain uncertain in many areas, the increasing push for clearer frameworks could provide stability to the market. As governments and financial institutions set up structures for cryptocurrency adoption, established cryptocurrencies like Dogecoin could gain more legitimacy, integrating into traditional financial systems and further elevating their market position.
🧨 Our team's main opinion is: 🧨
Dogecoin has become a significant asset in Elon Musk's business ecosystem, driven by his strong support and advocacy. Musk's involvement has helped propel Dogecoin into the mainstream, bridging the gap between the business world and crypto.
While new competitors may emerge, Musk’s continued backing ensures Dogecoin’s relevance.
The launch of XMoney, a blockchain payment system for Musk’s companies, could further boost Dogecoin's use. Musk’s connection to Trump has also sparked renewed interest in digital assets, providing upward momentum for Dogecoin. Technical indicators suggest a potential price surge as Dogecoin nears a breakout.
The broader crypto market trends, blockchain development, and growing institutional adoption signal a positive future for Dogecoin. AI advancements may further enhance Dogecoin's appeal, increasing its accessibility.
Clearer cryptocurrency regulations could increase stability and legitimacy for Dogecoin. As Musk remains a key figure, Dogecoin is likely to maintain its strong position in the crypto ecosystem.
Give me some energy !!
✨We invest countless hours researching opportunities and crafting valuable ideas. Your support means the world to us! If you have any questions, feel free to drop them in the comment box.
Cheers, Mad Whale. 🐋

Will the support level of 0.31097 be broken ?Breaking the range specified in the previous analysis and correcting the price to the lower range

DOGECOIN - Time to buy again!As you can see, the price is forming two bullish patterns on the 4h timeframe, If my view is correct, DOGECOIN will rise to $0.50 .
And if this pattern is correct and breaks, higher targets are possible.
Give me some energy !!
✨We spend hours finding potential opportunities and writing useful ideas, we would be happy if you support us.
Best regards CobraVanguard.💚
_ _ _ _ __ _ _ _ _ _ _ _ _ _ _ _ _ _ _ _ _ _ _ _ _ _ _ _ _ _ _ _
✅Thank you, and for more ideas, hit ❤️Like❤️ and 🌟Follow🌟!
⚠️Things can change...
The markets are always changing and even with all these signals, the market changes tend to be strong and fast!!

Nothing !!!Once again, The price action could drop to $0.33 and then return to its peak. It will take some time to recover from the damage that these sh*t meme coins have done to the crypto market.
Give me some energy !!
✨We spend hours finding potential opportunities and writing useful ideas, we would be happy if you support us.
Best regards CobraVanguard.💚
_ _ _ _ __ _ _ _ _ _ _ _ _ _ _ _ _ _ _ _ _ _ _ _ _ _ _ _ _ _ _ _
✅Thank you, and for more ideas, hit ❤️Like❤️ and 🌟Follow🌟!
⚠️Things can change...
The markets are always changing and even with all these signals, the market changes tend to be strong and fast!!

Doge road to $14king's ideas presents specific price points for the rally Doge is about to embark on. Target...$14.

doge updatedoge is in a downward channel looks like we are in a sub wave-c of a bigger picture C-wave my short term target would be around support at 0.30 then we should recover short term and if this pattern plays out it would be very bearish taking you to 0.15-0.20 only if pattern stays verified until i see a strong reversal i will remain bearish

#DOGE at a Pivotal Trendline – Bounce or Breakdown?#DOGE is definitely at a critical point right now, sitting on this trendline. A break below it could send the price down to the red box at 0.30-0.28 levels .
That said, I’m leaning towards a solid bounce here. RSI and Stoch are extremely oversold across MTFs (D, H4, H1), which hints at a recovery. But let’s be real—what happens next largely depends on #BTC.
On the bright side, USDT dominance is already showing signs of rejection, which is a good sign. It might head back to levels like 3.97–3.93/3.92 , clearing the gap and potentially giving CRYPTOCAP:DOGE a boost. We could see it climb back to 0.38 (where the H4 POC is) or at least cover the FVG around 0.35.
Overall sentiment is looking good too, with a 30.34% bullish market outlook on the daily TF.
Let’s see how this plays out.
Disclaimer:
This analysis is for informational purposes only and should not be considered financial advice. Always conduct your own research and consult with a professional financial advisor before making any investment or trading decisions. Trading involves significant risk, and you may lose more than your initial investment. Past performance is not indicative of future results. Trade responsibly.

E.N.D DogeCoin ?good morning everyone, as you can see in my DOGE chart. right now, we already break the bear blag pattern and we will going down to 0,2 (TARGET FULL TP).. I don't see any reversal pattern and big buy volume at this moment..
but if you see again my DOGE chart, there is support area around 0,30 until 0,31.. if we break the support, 0,2 will coming soon.
Wdyt ?
#DYOR

DOGE potential for 19% short term gain based on Neural Network
Hi all, I developed an simplified AI indicator and I applied it to the DOGE 4 hour time frame chart and got positive results. On average, the backtest is showing roughly a 19% gain per LONG trade. According to the script, we just exited a short trade, and entered a long trade, and the average long trade yields 19%.
Looking at DOGE’s recent price action and leveraging my custom neural network backtest, there's a strong possibility that the coin could see a short-term gain. The model has been extremely accurate in predicting these types of moves, taking into account factors such as market momentum and volume patterns. With the technicals aligning, it appears that DOGE is positioned for a bounce, especially with the broader crypto market showing positive signals.
Keep an eye on DOGE, as the bullish momentum might just surprise us with something bigger.

$BINANCE:DOGEUSDT BINANCE:DOGEUSDT
Deadly silence in the last few days.
Can surge either ways soon!!

DOGE Doge coin 24 hr potterbox with a up channelDOGE Doge coin is making higher highs and higher lows. as we can see with the channel showing a up trend. it is following other coins of the same parameters and they are trending up or sideways right now. I think They Are consolidating getting ready for a move up. but the data does not lie. We are below the 50 percent line or cost basis. .36869 You can adjust the box a little and see that there is hardly any movement just sideway action. I just keep adding to my positions with a stop around .31000 ish which is the floor of the box. I feel like it's going to go up over the next couple of weeks. upward movement with some sideways action to give people a good scare. I believe that you need to be able to wake up, take a look at the market and if you are 50 percent down you need to be able to roll over and go back to sleep. No worries. Happy trading. educational purposes only. Have a good day.
Update to Dogecoin Broadening Wedge.It's been quite the ride eh? lol As we near February, I expect everything to be very volatile. Dogecoin still has bullish volatility on the Weekly while developing a gnarly Bullish Pennant Pattern on the Daily. Both measurements lead Dogecoin possibly reaching 1.85. But if the Bullish Pennant doesn't hold and we break the .382 Fib.. expect pullbacks to .236. Stay Frosty and Good luck

UPDATE: Dogecoin is finally seeing some real movement!UPDATE: Dogecoin is finally seeing some real movement! Dogecoin is set to hit a maximum of $0.57 USDT. After this, the crypto world will start to push.

UPDATE: The Long Term Story of Dogecoin!UPDATE: The Long Term Story of Dogecoin! All other assets will look identical to this one. Consider yourself warned!


DOGEUSDT.1DThe daily chart of DOGE/USDT showcases a consolidation phase within a range-bound structure, following a period of significant bullish momentum earlier. This phase presents both bullish and bearish scenarios depending on the breakout direction.
Key Levels of Interest:
Resistance Levels:
R1: The immediate resistance lies at $0.4285, a critical barrier for bulls to overcome. This level aligns with previous highs and has repeatedly rejected price advances.
R2: The longer-term resistance trendline, marked in red, indicates the potential for upward expansion toward $0.5000–$0.6000, provided the bullish momentum sustains.
Support Levels:
S1: The nearest support is at $0.2574, marking the lower boundary of the current range and a strong accumulation zone.
Chart Patterns and Market Structure:
The price is trading within a horizontal range, with the upper boundary at R1 and the lower boundary at S1.
A breakout above R1 would indicate bullish continuation, with the potential to target R2 and higher levels. Conversely, a breakdown below S1 could trigger a deeper correction.
Technical Indicators:
MACD (12, 26, close): The MACD histogram is neutral, with the lines converging near the zero line. A bullish crossover could confirm upward momentum, while a bearish crossover may signal downside risks.
RSI (14): The RSI is currently neutral at 52.32, suggesting that the market is balanced but leaning slightly bullish. A move above 60 would confirm bullish strength, while a dip below 40 could indicate renewed selling pressure.
Volume and Momentum:
Volume has been decreasing, which is typical in consolidation phases. A significant volume spike will likely accompany the breakout or breakdown, confirming the next major move.
Conclusion: DOGE is currently consolidating within a well-defined range. The key level for a bullish breakout is $0.4285 (R1), which would likely lead to a move toward $0.5000–$0.6000 (R2). On the flip side, a breakdown below $0.2574 (S1) would expose DOGE to lower levels, potentially testing $0.2000 or further downside.
Strategic Approaches:
Bullish Setup: Consider long positions upon a confirmed breakout above R1, with targets at R2 and beyond. Set stop losses just below R1 to manage risk.
Bearish Setup: Enter short positions if the price breaks below S1, targeting lower support levels near $0.2000. Place stop losses above S1.
Risk Management: As DOGE is trading within a range, false breakouts are a possibility. Use tight stop losses and confirm breakouts with volume spikes before entering trades.

DOGE USDTCRYPTOCAP:DOGE looks ready for its next explosive move—don’t miss this setup! 🚀
#DOGE USDT The Best Support Area near $0.264 is holding strong, signaling a potential bounce
Price action suggests a bullish reversal is on the horizon with targets aligned for a strong rally.
🎯 Target 1: $0.415
🎯 Target 2: $0.547
🎯 Target 3: $0.684

DOGE Analysis: Unpacking Liquidity & the Battle at Support👀 👉 In this video, we take an in-depth look at Dogecoin (DOGE) paired with USDT. We analyze the trend, market structure, price action, key support and resistance levels, and the role liquidity plays in the markets. Currently, DOGE is trading at a significant support level. On the daily timeframe, there's a case for higher highs and higher lows, while the weekly chart shows bearish pressure over the past week. The big question is: where does it go next? We unpack it all in this video. This is not financial advice.
