DOGEUSD Started its final rally and can hit $1.300Dogecoin (DOGEUSD) just broke above its 1W MA50 (blue trend-line) again for the first time since March 24 2025 and is doing so after a clear rebound on its 1W MA100 (green trend-line). This is a technical bottom formation, that resembles the one on September 11 2017, right before that Cycle's final rally was initiated.
The 1W RSI has already broken above its MA trend-line (yellow) and every time that took place since October 16 2023, DOGE posted a strong rally. As you can see, the similarities between the two fractals are remarkable, both unfolding a structured bullish pattern on similar stages, with a 1W MA50/100 Bullish Cross leading to the massive Bull Flag (green) that bottomed on the 1W MA100 and initiating the parabolic rally.
In 2017 it topped on the 1.786 Fibonacci extension, so if it continues to replicate that fractal, we expect this run to hit $1.300 by the end of the year and make the Cycle's Top.
-------------------------------------------------------------------------------
** Please LIKE 👍, FOLLOW ✅, SHARE 🙌 and COMMENT ✍ if you enjoy this idea! Also share your ideas and charts in the comments section below! This is best way to keep it relevant, support us, keep the content here free and allow the idea to reach as many people as possible. **
-------------------------------------------------------------------------------
💸💸💸💸💸💸
👇 👇 👇 👇 👇 👇
DOGEUSDT_89DA41.USD trade ideas

DODGE LongDodge is now net long on the regression break.
I am considering all my options in the CRYPTO world.

buying??!@Dogecoin temporary buy strong corrective zone after that strong possibility of continued downward trend unless confirmed to break the general downward trend and bullish trend

DOGE Explodes +7% – Major Supply Zone Hit! Will the Rally Hold?”Dogecoin (DOGE/USD 1H) – Sharp Rally into Supply Zone!
DOGE just printed a massive +6.84% breakout, surging straight into a key supply zone between 0.1835 and 0.1900, as identified by LuxAlgo's Supply & Demand.
What’s happening:
Clean break above previous resistance at 0.1700
Entering high-volume node (0.1835–0.1900), where sellers previously dominated
RSI likely overheating on lower TFs, signaling potential short-term exhaustion
Key Zones to Watch:
Resistance: 0.18465–0.1900 (major supply = likely rejection or breakout trap)
Support: 0.1700 (former resistance now flipped support)
Demand Base: 0.1557–0.1500 (ideal long reload zone if price dips)
Scenarios:
Bullish Breakout: Clear move and close above 0.1900 = fresh rally potential toward 0.21+
Rejection Play: If supply holds, expect pullback to 0.1700 or deeper into demand zone (0.1550 area)
How I'm trading it:
Watching PA at 0.1850–0.1900 closely
Entering shorts if rejection candle confirms
Long reload only at 0.1700 or 0.1550 if structure remains bullish
DOGE moves fast — are you long or waiting for a pullback?
#Dogecoin #Crypto #DOGEUSD #Breakout #LuxAlgo #SupplyAndDemand #TradingView #CryptoTrading #Altcoins

DOGE/USDT: Descending Triangle Breakout with Bullish PotentialA weekly chart of DOGE/USDT on Binance, spanning from 2017 to early 2025 shows a clear descending triangle pattern that has formed over several years, characterized by a flat support base around $0.0030-$0.0040 (2017-2020) and a downward-sloping resistance trendline connecting lower highs over time. The price has recently broken out of this pattern and is showing signs of bullish momentum.
Descending Triangle Pattern:
- A descending triangle is typically a continuation pattern, but in this case, it acted as a reversal pattern after a prolonged downtrend. The flat base of the triangle (around $0.0030-$0.0040) served as strong support, with the price bouncing off this level multiple times between 2017 and 2020.
- The upper trendline of the triangle, which slopes downward, connected key lower highs at approximately $0.069 (2018), $0.018 (2019), and $0.010 (2020). This trendline was tested multiple times, showing consistent selling pressure at these levels.
- In early 2021, the price broke above this trendline with a strong bullish candle, accompanied by a significant spike in volume (visible at the bottom of the chart). This breakout confirmed the end of the consolidation phase and the start of a new uptrend.
Post-Breakout Price Action:
- After the breakout, DOGE/USDT surged dramatically, reaching a high of $0.737 in 2021, driven by market hype and increased adoption. However, the price then entered a corrective phase, pulling back to retest the breakout level around $0.169 in 2023. This retest is a common occurrence after a breakout, as it confirms the previous resistance as new support.
- The price has since consolidated in a range between $0.130 and $0.237, forming a rectangular consolidation zone (highlighted in yellow on the chart). This range indicates indecision in the market, with buyers and sellers battling for control.
- Recently, the price has approached the upper boundary of this range at $0.237, and the current candle (as of early 2025) shows a push towards this resistance. A breakout above this level would signal the continuation of the bullish trend.
Key Levels to Watch:
- Support Zone ($0.130-$0.150): This area has acted as a strong support during the consolidation phase. If the price fails to break above $0.237, it may pull back to this zone for another retest. A break below $0.130 would invalidate the bullish setup and could lead to a deeper correction towards $0.069.
- Resistance Zone ($0.237): This is the immediate hurdle for DOGE/USDT. A confirmed break above this level, especially with strong volume, would confirm the continuation of the uptrend.
- Next Resistance ($0.400-$0.450): The measured move of the descending triangle can be calculated by taking the height of the triangle (from the base at $0.003 to the highest point at $0.069, roughly $0.066) and adding it to the breakout point (around $0.169). This gives a target range of $0.235-$0.400. However, considering the momentum and historical price action, the price could extend towards $0.450 if bullish sentiment persists.
Volume Analysis:
- Volume spiked significantly during the breakout in 2021, confirming the strength of the move. However, during the consolidation phase (2023-2025), volume has been relatively low, indicating a lack of strong directional momentum.
- For the breakout above $0.237 to be valid, we would ideally want to see an increase in volume, signaling renewed buying interest. Without this, the breakout could be a false move, leading to a rejection and pullback.
Market Context and Risks:
- DOGE/USDT is known for its volatility, often driven by market sentiment, social media hype, and news events. While the technical setup looks bullish, external factors could impact the price. For example, a broader market downturn or negative news could lead to a rejection at $0.237.
- The weekly timeframe suggests a long-term perspective, so traders should be prepared for potential short-term volatility. Using a stop loss below $0.169 helps manage risk in case the setup fails.

DOGEUSD: Building a Base Before the Next Bull Run?Dogecoin is currently consolidating near a critical demand zone (0.13996 – 0.16825) — a level that previously sparked strong bullish reactions. With U.S. macro news on the horizon (FOMC, Jobs Data), this zone could be the launchpad for the next leg up.
Key Technical Levels:
Major Demand Zone: 0.13996 – 0.16825 (orange block) – buyers consistently defend this area
First Bullish Target: 0.30279 – mid-range supply zone
Ultimate Target: 0.43436 – high-volume node and multi-month resistance
Why This Matters: This tight range could be a classic accumulation phase before a breakout. The repeated defense of this zone, plus increasing wicks on the downside, suggest smart money may be loading up.
Bullish Scenario: If DOGE can hold above 0.168 and break out of this demand area with volume, a rally toward 0.30+ becomes highly likely. A close above that could trigger momentum-based buying and FOMO-driven moves into the 0.43 range.
Watch for:
Bullish reversal patterns (e.g. double bottom, engulfing candle)
Volume spikes confirming breakout from the base
Reaction to upcoming USD news events
Let’s Discuss: Are the whales quietly buying DOGE again? Is a meme coin rally brewing?
Drop your thoughts and follow for more setups! #Dogecoin #DOGE #CryptoAnalysis #Altcoins #TradingView #LuxAlgo #PriceAction #CryptoSetup #BreakoutTrade #SupportAndResistance

Weekly trading plan for DOGEIn this idea I marked the important levels for this week and considered a few scenarios of price performance
The price is already under the Pivot points closer to the local bottom, so when the local bottom is broken, the further decline to the support areas is expected
Write a comment with your coins & hit the like button and I will make an analysis for you
The author's opinion may differ from yours,
Consider your risks.
Wish you successful trades! MURA

Doge H4 | Overlap support at 38.2% Fibonacci retracementDoge (DOGE/USD) is falling towards an overlap support and could potentially bounce off this level to climb higher.
Buy entry is at 0.1667 which is an overlap support that aligns close to the 38.2% Fibonacci retracement.
Stop loss is at 0.1460 which is a level that lies underneath an overlap support and the 61.8% Fibonacci retracement.
Take profit is at 0.2028 which is a swing-high resistance.
High Risk Investment Warning
Trading Forex/CFDs on margin carries a high level of risk and may not be suitable for all investors. Leverage can work against you.
Stratos Markets Limited (tradu.com):
CFDs are complex instruments and come with a high risk of losing money rapidly due to leverage. 63% of retail investor accounts lose money when trading CFDs with this provider. You should consider whether you understand how CFDs work and whether you can afford to take the high risk of losing your money.
Stratos Europe Ltd (tradu.com):
CFDs are complex instruments and come with a high risk of losing money rapidly due to leverage. 63% of retail investor accounts lose money when trading CFDs with this provider. You should consider whether you understand how CFDs work and whether you can afford to take the high risk of losing your money.
Stratos Global LLC (tradu.com):
Losses can exceed deposits.
Please be advised that the information presented on TradingView is provided to Tradu (‘Company’, ‘we’) by a third-party provider (‘TFA Global Pte Ltd’). Please be reminded that you are solely responsible for the trading decisions on your account. There is a very high degree of risk involved in trading. Any information and/or content is intended entirely for research, educational and informational purposes only and does not constitute investment or consultation advice or investment strategy. The information is not tailored to the investment needs of any specific person and therefore does not involve a consideration of any of the investment objectives, financial situation or needs of any viewer that may receive it. Kindly also note that past performance is not a reliable indicator of future results. Actual results may differ materially from those anticipated in forward-looking or past performance statements. We assume no liability as to the accuracy or completeness of any of the information and/or content provided herein and the Company cannot be held responsible for any omission, mistake nor for any loss or damage including without limitation to any loss of profit which may arise from reliance on any information supplied by TFA Global Pte Ltd.
The speaker(s) is neither an employee, agent nor representative of Tradu and is therefore acting independently. The opinions given are their own, constitute general market commentary, and do not constitute the opinion or advice of Tradu or any form of personal or investment advice. Tradu neither endorses nor guarantees offerings of third-party speakers, nor is Tradu responsible for the content, veracity or opinions of third-party speakers, presenters or participants.

DOGECOIN -Rejection From Key Supply Zone |Bears Gaining Control?Dogecoin is facing heavy resistance near the $0.1835 supply zone, where multiple rejections suggest buyer exhaustion. This level is also aligned with the LuxAlgo Supply and Demand Visible Range, adding more confluence to the bearish bias.
Key Observations:
Strong rejection from $0.1835 - $0.1800 supply zone.
Bearish momentum building below resistance.
Price forming a potential double top structure with lower highs.
Targets if Breakdown Confirms:
$0.1606 – Mid-range support and recent consolidation level.
$0.1399 – Major demand zone and high-volume area.
Breakdown below $0.1606 could trigger a sharper selloff into the orange demand zone.
Watch for:
Breakdown candle below $0.175 + retest = entry signal.
Bearish continuation pattern confirmation.
News catalysts (highlighted on chart for May 5–9) could add volatility.
Trade Idea:
Short bias below $0.175 with targets at $0.160 and $0.140.
Invalidation: Clean break above $0.1835 with strong bullish candle.
What’s your bias on DOGE? Drop a comment below – Long or Short?
---
#Dogecoin #DOGEUSD #CryptoTrading #SupplyAndDemand #LuxAlgo #Altcoins #BearishRejection #PriceAction #TradingView


DOGE/USD – Bullish Bounce from Demand Zone?DOGE is currently testing a strong demand zone near the $0.17900–$0.18000 level, identified by the orange shaded area. This zone has already acted as solid support earlier, and we’re seeing bullish wicks forming again, hinting at a potential bounce.
Key Technical Highlights:
Demand Zone (Support): $0.17900–$0.18000
Immediate Resistance: $0.18183
Key Supply Zone (Resistance): $0.18351–$0.18400
Price Action: Repeated rejection of lows at demand; signs of exhaustion in selling pressure
Bullish Triggers: Reclaim of $0.17999 could trigger a move back to $0.1818 and then $0.1835
Watch for: Break and retest of $0.1818 for bullish continuation
Potential Trade Setup (Not Financial Advice):
If price confirms a reversal from the demand zone, a long setup toward the $0.1818 and $0.1835 supply zones could be in play. SL below $0.1790, TP zones as marked.
Market Sentiment: Slightly bearish but short-term recovery likely from demand zone unless this support fails.
What to watch:
Price behavior at $0.1800
5- and 15-min volume confirmation on bounce
MACD/RSI divergence (if using oscillators)

DOGECOIN: S/T Trade. Set-up on hourly, enter on 5min TFDogecoin setting up to trend continuation.
- 1 HR TF (HTF)
- Broken the pullback phase
- Flush to downside
- Narrow state
- Above 200MA
- 9 EMA and 21EMA above 200MA and rising
- Enter at break above flag (look to enter on LTF)
- 1st target recent major swing high
- R/R 2:1 (1st target)

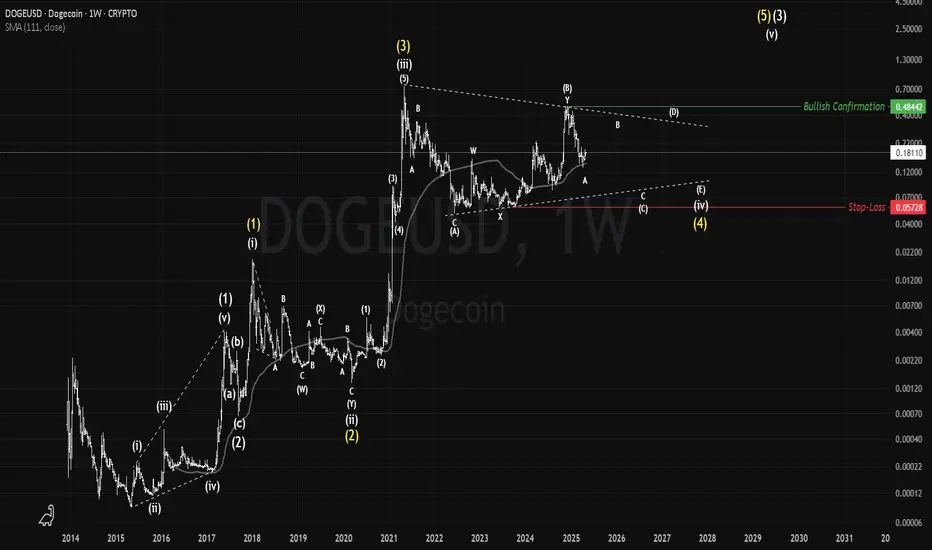
DOGE: The Dogecoin ArmyCRYPTOCAP:DOGE is among the top10 cryptocurrenices and although it's a memecoin but it's a legit store of value. After it's historical run during 2020/2021, it went in a 4 years long correction so far that is still ongoing and expected to last another couple of years as long as the price stays in the current bullish triangle pattern. By holding above $0.057 (the stop-loss) and below the level of $0.48 which passing it confirms targeting a new all-time high.
#Dogecoin
DOGE/USD - Double Top Near Supply? Price Rejection ConfirmingDogecoin tested the $0.17922 supply zone again—and failed to break. We’re seeing a potential double top setup and early signs of rejection.
Key Levels:
Supply Zone: $0.17922 acting as strong resistance.
Immediate Support: $0.17601 – former resistance now being retested.
Major Demand Zone: $0.16958–$0.16700 – where buyers previously stepped in hard.
Trade Insight:
Bearish momentum could push price back toward $0.17600, and potentially down to $0.16950 if support cracks.
Volume and wick action at the top suggest exhaustion.
LuxAlgo zones confirm strong resistance alignment.
Quick Short Setup:
Entry Zone: $0.17850–$0.17900
Stop Loss: $0.17980
Targets: TP1: $0.17600, TP2: $0.16980
This is a high-probability scalp or intraday swing, especially if price fails to reclaim $0.179 on the next retest.
---
#DOGEUSD #Dogecoin #CryptoTrading #LuxAlgo #PriceAction #SupplyAndDemand #CryptoScalping #Altcoins

DOGECOIN broke the supportDogecoin has been consolidating within the downtrend channel for the past week and we just observed it breaking the support earlier. We may look to reenter shorts during the pullback so we can enter and target to the next support.
Please do not risk more than 1% per trade。
If you like the idea, please help like the post and comment down your thoughts below! I would love to hear your thoughts!

ResistanceThis asset is consolidating under a key level 0.1755 and under the 200 EMA(orange) and close to the 50 EMA (purple), bullish breakout with no fake outs could push price to 0.1793 and possibly beyond, a bearish breakout with no fake outs to 0.17277 possibly lower. The consolidation is text book bullish, ascending triangle, but the resistance combined with the moving averages poses a problem.

Doge H4 | Potential bullish bounceDoge (DOGE/USD) is falling towards a pullback support and could potentially bounce off this level to climb higher.
Buy entry is at 0.1667 which is a pullback support that aligns close to the 38.2% Fibonacci retracement.
Stop loss is at 0.1460 which is a level that lies underneath a multi-swing-low support and the 61.8% Fibonacci retracement.
Take profit is at 0.2028 which is a swing-high resistance.
High Risk Investment Warning
Trading Forex/CFDs on margin carries a high level of risk and may not be suitable for all investors. Leverage can work against you.
Stratos Markets Limited (tradu.com):
CFDs are complex instruments and come with a high risk of losing money rapidly due to leverage. 63% of retail investor accounts lose money when trading CFDs with this provider. You should consider whether you understand how CFDs work and whether you can afford to take the high risk of losing your money.
Stratos Europe Ltd (tradu.com):
CFDs are complex instruments and come with a high risk of losing money rapidly due to leverage. 63% of retail investor accounts lose money when trading CFDs with this provider. You should consider whether you understand how CFDs work and whether you can afford to take the high risk of losing your money.
Stratos Global LLC (tradu.com):
Losses can exceed deposits.
Please be advised that the information presented on TradingView is provided to Tradu (‘Company’, ‘we’) by a third-party provider (‘TFA Global Pte Ltd’). Please be reminded that you are solely responsible for the trading decisions on your account. There is a very high degree of risk involved in trading. Any information and/or content is intended entirely for research, educational and informational purposes only and does not constitute investment or consultation advice or investment strategy. The information is not tailored to the investment needs of any specific person and therefore does not involve a consideration of any of the investment objectives, financial situation or needs of any viewer that may receive it. Kindly also note that past performance is not a reliable indicator of future results. Actual results may differ materially from those anticipated in forward-looking or past performance statements. We assume no liability as to the accuracy or completeness of any of the information and/or content provided herein and the Company cannot be held responsible for any omission, mistake nor for any loss or damage including without limitation to any loss of profit which may arise from reliance on any information supplied by TFA Global Pte Ltd.
The speaker(s) is neither an employee, agent nor representative of Tradu and is therefore acting independently. The opinions given are their own, constitute general market commentary, and do not constitute the opinion or advice of Tradu or any form of personal or investment advice. Tradu neither endorses nor guarantees offerings of third-party speakers, nor is Tradu responsible for the content, veracity or opinions of third-party speakers, presenters or participants.

$DOGE: History doesn’t repeat itself but it often rhymesVery simple outlook, doge has broken out of its 4 year consolidation channel and is sitting right on top of the breakout support with an oversold weekly rsi . Now we sit back and watch what happens this summer.
BINANCE:DOGEUSDT
COINBASE:DOGEUSD
CRYPTOCAP:DOGE
CRYPTO:DOGEUSD

Weekly plan for DOGEIn this video I marked the important levels in this video for this week and considered a few scenarios of price performance
On the chart we can see a local trend line from which the price may rebound and we will see the realization of the green scenario. If the local trend line will be broken, we can expect a correction to the Pivot point of this week
If the price gets stuck under the Pivot point, then there will be more chances to see a downward movement to the support zone 1
Write a comment with your coins & hit the like button and I will make an analysis for you
The author's opinion may differ from yours,
Consider your risks.
Wish you successful trades! MURA

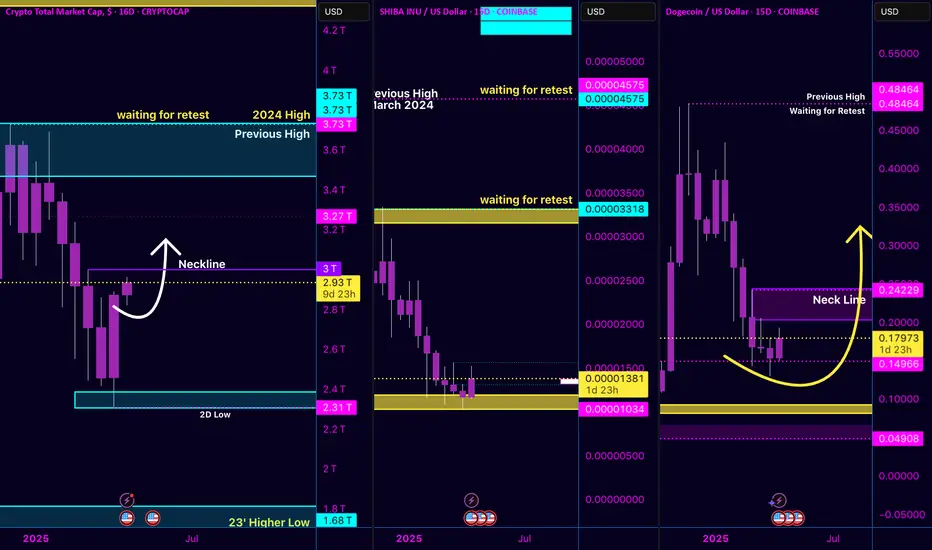
Total Market Structure Is Bullish — DOGE and SHIB Gearing Up Market Insight:
When the Crypto Total Market Cap structure is bullish or bearish, most tokens follow the same direction.
We haven't reached full global adoption yet (fact: altcoin prices remain highly correlated to Bitcoin and Total Cap momentum), so true independent token movement is still rare.
In this chart, you’ll see how SHIB and DOGE are setting up in sync with the Total Cap recovery:
📈 DOGE is showing a strong structural pullback — a classic second-chance entry opportunity for those who missed the earlier rally. Structure remains intact, and buyers are defending key levels.
📈 SHIB is also stabilizing and building pressure. If the broader market continues upward, SHIB looks positioned to finally break through 0.00004575, targeting new liquidity zones.
Key Takeaways:
Follow Market Cap structure — when it flips bullish, most altcoins (especially meme coins) gain momentum.
Structure over candles: Ignore individual green/red candles. Focus on previous highs, retests, and new higher highs forming.
Entry strategy: Watch for clean breakouts above previous highs and retest confirmations to stack probability in your favor.
#CryptoMarketCap#DOGE#SHIB#CryptoTrading#TechnicalAnalysis#Altcoins
The overall crypto market is rebuilding strength. It's about being patient, respecting structure, and letting the market pull you into winning trades — not chasing.
DOGE THE COIN THAT SMILESTraders,
Lets keep this one simple. You will often here in trading the phrase "History doesn't always repeat itself but, it often rhymes!". Well it seems like we have that exact phrase happening right now. Doge will always be one of my favorite coins as it was the first coin to make me some serious money in crypto and ever since there has been no looking back. Lots of people do not understand DOGE or why it creates such high gains but, I firmly believe it will soon hush the naysayers and produce some fat green candles for us all!
I hope you had a great weekend and we will see you at the top!!!
Stay profitable folks,
Savvy

DOGE Massive Move is in CardsSame Trampolines set up as before. Super Mario style Spring Jump.
The information and publications are not meant to be, and do not constitute, financial, investment, trading, or other types of advice or recommendations

DOGE Daily MA Hints and CluesDOGEUSD Daily Outlook: Signs of Accumulation?
Thanks for taking the time to check out my analysis on DOGEUSD. Let’s dive in.
Most traders are familiar with moving averages and crossover signals — and while these are often viewed as lagging indicators, I’ve found that using multiple moving averages together can offer much clearer insights, especially when paired with other supporting tools.
On this chart, I’m using a combination of simple moving averages (SMA) and exponential moving averages (EMA). I’ll break down the specific MAs I'm using in a follow-up post, but for now, I want to highlight what the moving average structure is showing us right now — and how it compares to similar price action in the past.
Take a look at the yellow arrows on the chart:
The arrow on the right marks the current price position relative to the moving averages.
The arrow on the left points to a similar setup from the past.
As the old saying goes: “History doesn’t repeat itself, but it often rhymes.”
The last time DOGEUSD price action sat in this zone, we saw about 45 to 50 days of consolidation and chop before the market broke into a strong parabolic move higher. Projecting that same timeframe forward puts us somewhere around mid-June.
While nothing is guaranteed in the markets, this chart suggests that accumulation around this zone could present a favorable risk-reward setup for a potential run in the near to mid-term.
My Approach:
I began accumulating a position today and plan to add on pullbacks if the opportunity presents itself.
As always, this is not financial advice — just sharing my personal outlook and strategy. Wishing you all success out there — stay patient, stay sharp.
