DOGE/USDT – 3D Long Signal Active📅 April 29, 2025
The system triggered a long entry at the last 3D bar close.
Currently, the price remains around the same levels.
✅ System conditions for a long are fully met:
MLR > SMA > BB Center > PSAR
Price is trading above the 200 MA on the 3D timeframe.
⚠️ Caution:
On the 1D timeframe, price is still below the 200 MA, which suggests some lingering weakness. Proceed carefully.
📍 Strategy Plan:
Consider entering long at today’s daily close or at the next 3D bar close.
Suggested stop-loss: below the latest PSAR dot for system integrity.
🔔 Keep an eye on updates and thank you for reading! 📈📊
DOGEUSDT_89DA41 trade ideas

DogeUsdt Full Target Hello friends, this deal has also reached full target, Spot fell about 6%.
please support and give energy.
May you always be profitable 🌹

DOGE - Time to buy again!I think that price level at 0.382 has a good support, and from here the price can grow well.
Give me some energy !!
✨We spend hours finding potential opportunities and writing useful ideas, we would be happy if you support us.
Best regards CobraVanguard.💚
_ _ _ _ __ _ _ _ _ _ _ _ _ _ _ _ _ _ _ _ _ _ _ _ _ _ _ _ _ _ _ _
✅Thank you, and for more ideas, hit ❤️Like❤️ and 🌟Follow🌟!
⚠️Things can change...
The markets are always changing and even with all these signals, the market changes tend to be strong and fast!!

DOGE Breaks Out: Bullish Momentum Ahead?DOGE Breaks Out: Bullish Momentum Ahead?
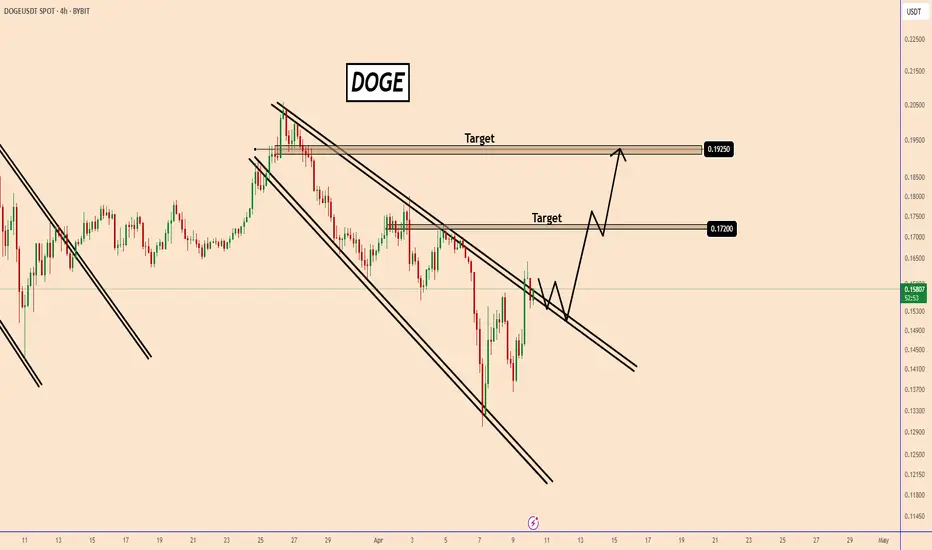
Analysis: DOGE has completed a bullish Broadening Wedge Pattern and has now broken out, suggesting the uptrend might continue. Market optimism is also increasing due to President Trump's announcement of a 90-day pause on reciprocal tariffs.
From its current position, DOGE could climb towards 0.1720, the first resistance level. A stronger resistance awaits near 0.1925, where the price was previously rejected.
You may find more details in the chart!
Thank you and Good Luck!
❤️PS: Please support with a like or comment if you find this analysis useful for your trading day❤️
Lingrid | DOGEUSDT Potential LONG on Pullback to SWAP ZoneThe price perfectly fulfilled my last idea . It reached the target. After a strong rally and fake breakout above the resistance near 0.1915, BINANCE:DOGEUSDT is now pulling back and trading inside a sideways range. Price is heading toward the 0.1700–0.1710 support area, which aligns with the upward trend-line. If bulls hold this zone, a rebound toward 0.1850 looks likely. As long as price stays above the trend-line, bullish structure remains valid.
📈 Key Levels
Buy zone: 0.1700 – 0.1710
Buy trigger: bounce from trend-line
Target: 0.1850
Sell trigger: break below 0.1700
💡 Risks
If price breaks below 0.1700, it may open the way toward deeper support.
Sudden spikes in Bitcoin or market-wide sentiment shifts can shake the setup.
Lower timeframe volatility near trend-line could trap early entries.
Traders, if you liked this idea or if you have your own opinion about it, write in the comments. I will be glad 👩💻

Doge short to 0.16863Just hopped into this doge short. Time sensitive. Expecting a fall to 0.16863 today before monthly close.
DTT strategy applied
Entry and stops on chart and target
Time sensitive

DOGECOINDogecoin (DOGE) is a cryptocurrency that originated as a fun, meme-inspired digital coin but has gained significant popularity and market presence.
Founder of Dogecoin
Dogecoin was created by Billy Markus and Jackson Palmer in December 2013.
Billy Markus, a software engineer from the United States, and Jackson Palmer, a marketer from Australia, developed Dogecoin as a lighthearted alternative to Bitcoin, incorporating the popular "Doge" internet meme featuring a Shiba Inu dog.
The founders aimed to create a more approachable and fun cryptocurrency with a strong community focus.
Founders Billy Markus and Jackson Palmer
Origin Created in December 2013 as a meme-based, fun cryptocurrency
Market Outlook Moderate growth expected in 2025, with price forecasts reaching $0.24 by May
Dogecoin remains popular due to its active community, wide acceptance for tipping and microtransactions, and occasional high-profile endorsements.

DOGEUSD LONG/BUYBy utilizing Fibonacci retracement levels, historical patterns, , we can formulate a hypothesis that the market might follow a similar trajectory if bullish sentiment prevails.

DOGE/USDT 1H: Accumulation Breakout – Long Setup Above $0.1790DOGE/USDT 1H: Accumulation Breakout – Long Setup Above $0.1790
🚀 Follow me on TradingView if you respect our charts! 📈 Daily updates!
Current Market Conditions (Confidence Level: 7.5/10):
Price at $0.17931, showing neutral-bullish structure after recent breakout above PDL.
Hidden bullish divergence spotted on RSI, indicating strength beneath the surface.
Smart Money accumulating heavily within discount zone ($0.15 – $0.16), supporting bullish bias.
Trade Setup (Long Bias):
Entry: $0.1790 – $0.1795 zone.
Targets:
T1: $0.1840
T2: $0.1920
Stop Loss: $0.1760 (below recent PDL).
Risk Score:
7/10 – Strong volume support at current levels but minor risk due to local consolidation near resistance.
Key Observations:
Break of structure signals start of markup phase.
Volume profile supports accumulation-to-expansion transition.
Strong support confirmed at $0.1760 zone, aligning with previous discount accumulation.
Momentum building above PDL suggests breakout has legs.
Recommendation:
Long positions favored within entry zone with tight stop loss below $0.1760.
Consider securing partial profits at $0.1840 and allowing runners towards $0.1920.
Monitor price action closely around $0.1840 for potential continuation or rejection signals.
🚀 Follow me on TradingView if you respect our charts! 📈 Daily updates!


Alert! Dogecoin Ready To Move Forward: Final CallThis is a chart setup with a perfect ABC correction. Spotting an ABC correction on a chart is always magical because it reveals the move that follows next, a bullish impulse.
Spotting the start of a bullish impulse is magical because money can be made. Making money is magical because we can enjoy all the great things money can buy in this wonderful life.
What would you do if you knew, with a high level of certain, that Dogecoin is about to move up?
What would you do if you knew, ahead of time, that something big is about to take place?
Would you take action now, or, would you miss the "train"?
The moment is now and the short-term consolidation is over before the next advance. Look at the chart. Tell me, what do you see?
Initially a strong rise and this rise was corrected. The correction finds support.
Now, there has been some bullish action but minimum, this action is only the start.
Notice Dogecoin is still trading low, near support; at bottom prices, the best time to buy before prices grow. This is it. This is a friendly reminder, I am wishing for you profits, success, health, wealth and personal growth.
DOGEUSDT is in a zone now with low risk for a buyer with high potential for reward. With this type of chart setup, you can't go wrong. Buy and hold.
Namaste.

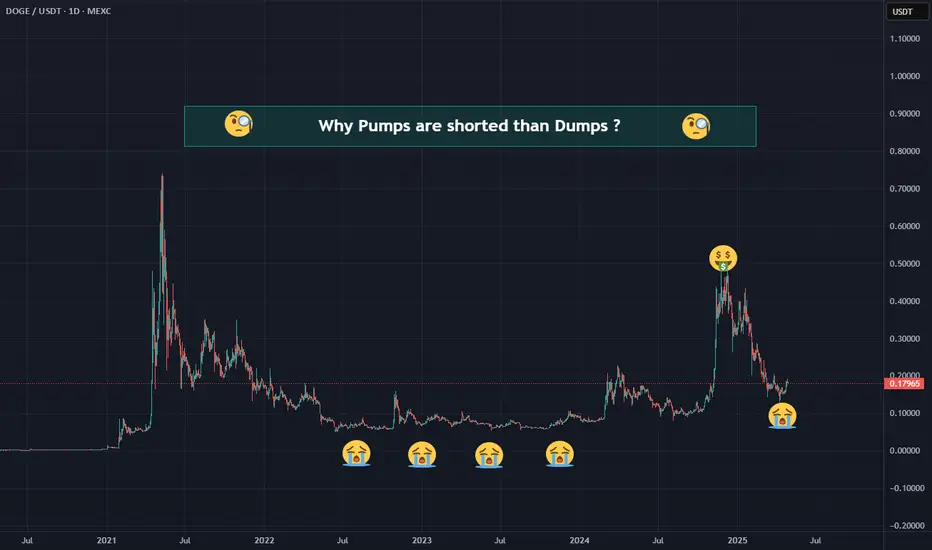
Crypto Psychology episode 3 : Why Pumps are shorter than Dumps ?If you've spent even a little time in crypto, you've probably noticed that prices tend to soar fast... but crash even faster. There’s actually some very real reasons behind why pumps are usually shorter than dumps. Let’s break it down:
Pumping Takes a Ton of Money — and Big Risk
Unlike what many think, pumping a coin’s price isn’t free. Market makers and whales have to inject huge amounts of money to drive prices up. That's a big risk, especially in the crypto world where projects can be shaky and unpredictable. They’re not going to keep risking millions for too long — the higher the price, the harder (and scarier) it gets to keep it flying.
Fear of Inflation Kills the Party Fast
One of the big reasons dumps hit so hard is fear — specifically fear that the project will start " printing more coins " or distributing tokens like candy. If people sense that inflation is coming, they rush for the exit. It doesn't matter how much money was pumped in ; no amount can fight against the fear of endless supply.
Too Many Longs? Time for a Harsh Correction
As the price pumps, more and more traders jump into long positions, betting the price will keep going up. For market makers, this becomes dangerous: if everyone is winning, they're losing. So to protect themselves, they often trigger a sharp correction to liquidate a bunch of longs and reset the market. Better to rip the bandage off quickly than let risk pile up.
Longs Are Always the Majority
In crypto, especially during pumps, long positions always outnumber shorts. People naturally get greedy — everyone wants to ride the rocket. But the more longs that build up, the more unstable the market becomes. This imbalance is part of why dumps are so sharp and brutal: it’s a giant, messy unwinding of overly optimistic bets.
Whales Use the Hype to Dump Fast
When a coin is pumping, retail traders get hyped — and whales see an opportunity. They start offloading their coins to eager buyers at higher prices. If they tried to do it slowly, the price would collapse before they finish selling. So they dump fast and hard, using the excitement against retail. It's ruthless, but it’s just how the game is played.
BINANCE:DOGEUSDT BINANCE:ADAUSDT BINANCE:XRPUSDT BINANCE:SOLUSDT BITSTAMP:BTCUSD
Long trade
DOGEUSD Buyside Trade – Full Journal
Date/Time: Sunday, 27th April 2025, 2:40 AM (New York Time)
Pair: DOGEUSD
Session: Tokyo to London Transition
Entry TF: 15-Minute
🔹 Entry: 0.17906
🔹 Take Profit: 0.18264 (+2.00%)
🔹 Stop Loss: 0.17857 (–0.27%)
🔹 Risk-Reward Ratio: 7.31
Trade Reasoning
Consolidation breakout during low liquidity hours provided an early sign of bullish interest.

DOGE / USD 15 MinWe will monitor the price action and wait for the moving averages and the orange volume zone to break through and close above them to buy.

The most beautiful trading opportunity of the year in DogecoinDogecoin has reached its uptrend line after a long time and is in the order block range. The positive hidden divergence is a testament to its strong uptrend in the near future.

DOGEUSDT is gonna pump hard this time wait for above 0.5$As we said before the red trendline is broke and market after 70% fall now is ready for another bull run here and we are looking for same targets like previous time for DOGEUSDT also if and only if 0.45$ break this time to the upside we can expect more rise to the targets like 0.75$ and more even.
DISCLAIMER: ((trade based on your own decision))
<<press like👍 if you enjoy💚

Nobody appreciate it !!!Currently, DOGE is forming an ascending triangle, indicating a potential price increase. It is anticipated that the price could rise, aligning with the projected price movement (AB=CD).
However, it is crucial to wait for the triangle to break before taking any action.
Give me some energy !!
✨We spend hours finding potential opportunities and writing useful ideas, we would be happy if you support us.
Best regards CobraVanguard.💚
_ _ _ _ __ _ _ _ _ _ _ _ _ _ _ _ _ _ _ _ _ _ _ _ _ _ _ _ _ _ _ _
✅Thank you, and for more ideas, hit ❤️Like❤️ and 🌟Follow🌟!
⚠️Things can change...
The markets are always changing and even with all these signals, the market changes tend to be strong and fast!!

Riskfree DogeUsdt 2% profitHello friends, please make Dogecoin trading risk-free, it gave us 2%, good luck 🌹

DOGEUSDT 1D AnalysisDOGE ~ 1D Analysis
#DOGE Buy gradually when re -testing this support with a short -term target of at least 10%+.

DOGE in the *Anger Phase*? Watch for the trap before the Rally 🚨 DOGE in the *Anger Phase*? Watch for the Trap Before the Rally Begins
📉 Based on recent price action and classic **market psychology cycles**, DOGE appears to be entering the **Anger Phase** — a point where many retail traders give up, blaming the market or external forces, while **smart money starts preparing to accumulate**.
Let’s break down the pattern I'm watching:
---
### 🧠 **Psychology Analysis:**
Using the well-known **Stock Market Psychology Cycle**, DOGE has already moved through:
- **Euphoria (~$0.43)**
- **Complacency → Denial (pullbacks to ~$0.28 and ~$0.20)**
- **Panic and Capitulation (drop to ~$0.14)**
📌 Now, price is hovering in the **$0.12–$0.13** range — matching the sentiment of **Anger**, where people say:
> *“This is manipulation! I’m done with this coin!”*
###🔮 **Price Forecast (My Playbook):**
- 🚀 **Short-term relief rally to ~$0.19** — This would attract late buyers, creating a **bull trap**.
- ⛔ **Pullback to ~$0.11** — Final shakeout, triggering stop-losses and "DOGE is dead" posts.
- 🔥 **Strong reversal targeting $0.23+**, fueled by:
- Tax season ending (April 15 effect)
- Meme coin rotation
- Potential DOGE narrative catalyst (as often happens unexpectedly)
### 🧭 **How I’m Playing It:**
- Watching closely for rejection near **$0.19**
- Planning to accumulate near **$0.11** if volume confirms support
- Targeting **$0.23+** as the **Disbelief rally** kicks in
Let me know your thoughts — do you see the same pattern playing out?
#DOGEUSDT #CryptoPsychology #MarketCycles #TradingViewIdeas #MemeCoins #SmartMoneyMoves

Massive Megaphone - DOGEUSDTAll it takes is a spark (godfather of Doge twitting something not gov related )
Not a financial advise or trading recommendation.

Doge Usdt ShortHello dear friends, I have a short theory on Dogecoin with a specified stop. The market is closed and the volume is low, please manage your money.

Dogecoin shortDecided to short dogecoin just now.
Targeting $0.1759
roughly 2RR
I think the market is likely to correct down a bit before higher prices. Plus its at a resistance area.
stop: $0.18316 or higher
This is more of a counter trend on higher tf so drop might not be smooth. I highlighted potential early reversal points on chart
