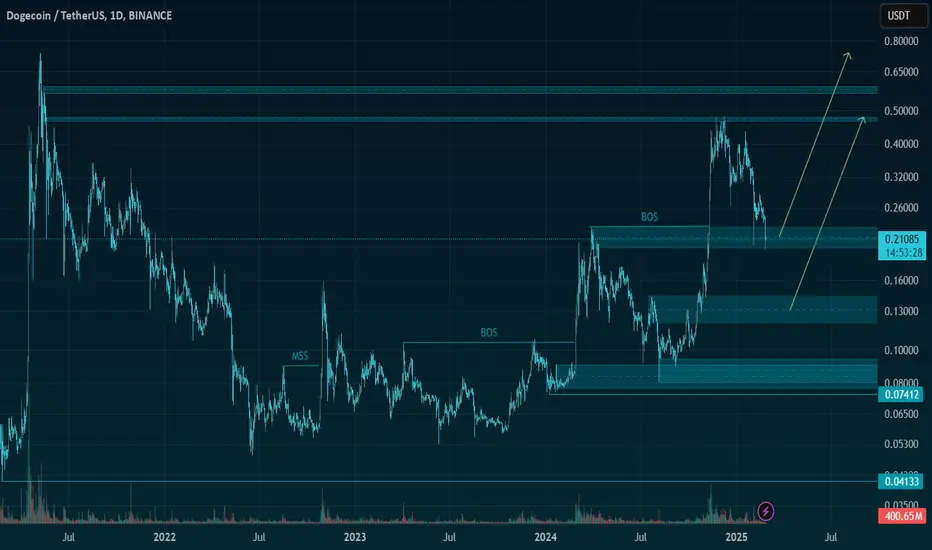
Doge to 1$Considering the recent movement of Dogecoin its most likely that we will see doge go to 1 dollar in the next 3 to 6 months .
only buy spot this idea is not for futures trading
DOGEUSDT_89DA41 trade ideas

Dogecoin longI've been watching dogecoin for a very long time. it can't be cheaper than this so I'm buying the price here. long entry 0.18590 stoploss 0.18200 target profit 0.7800 or 1.2300 or 2.000 or higher.

Long trade
Buyside trade
Pair ETHUSDT
Wed 26th Feb 24
3.30 pm
NY Session PM
Entry 0.19812
Profit level 0.22285 (1.84%)
Stop level 0.19523 (1.46%)
RR 18.56
Reason: Observing price action across the markets since yesterday indicates a macro move to the upside and buyside trade idea.

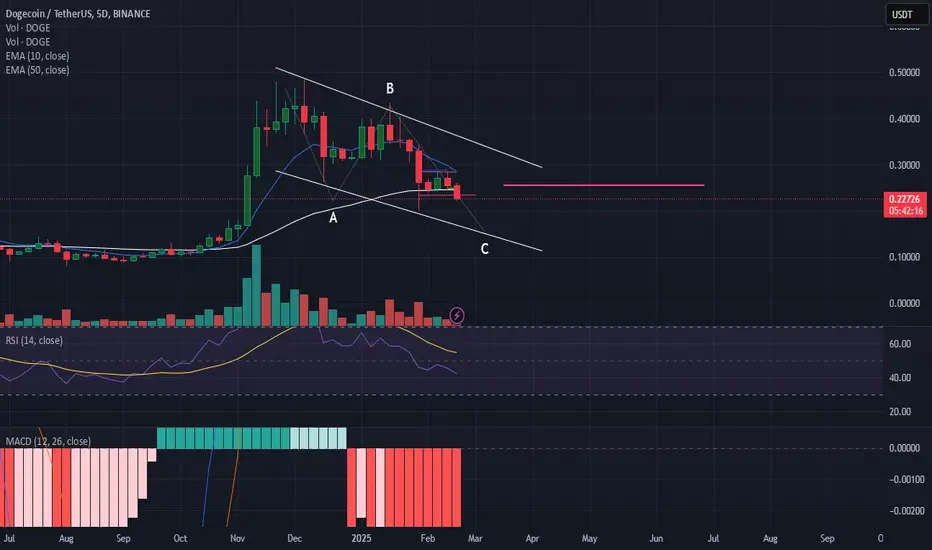
DogeUsdt Falling Wedge Watching this as a falling wedge continuation to the upside.
Am not convinced that the bottom is in for the next leg higher market wide.
Expecting a rejection of upper trend of wedge resistance line to then put in an interim low of around 0.175 prior to my expectations of a sustained breakout if the market plays ball.
Monitor 23.5 dollar level for initial breakout setup or reject to 17.5 for longs

DOGEUSDT LongThe wick having been filled , DOGE presents an impecable R:R here .
This kind of opportunities come once a few months so better take advantage of them .
BTC has been dropping yesterday to 82K while alts were showing strenght shows that people were ready to deploy capital into alts once BTC touched ~85k.

DOGE Bullish Potential Amid Market UncertaintyDOGE Bullish Potential Amid Market Uncertainty
DOGE has completed a bullish harmonic pattern, increasing the potential for a price rise. However, the risk lies in the overall bearish trend of BTC and the broader cryptocurrency market, which adds a layer of unpredictability.
If DOGE does not establish a new lower low, the likelihood of an upward movement increases. Therefore, closely monitor this zone.
Key Resistance Areas:
0.2330
0.2550
0.2800
You may find more details in the chart!
Thank you and Good Luck!
❤️PS: Please support with a like or comment if you find this analysis useful for your trading day❤️

DOGE - LONGI think Doge will rise soon. It has support around 0.155, and I don't think it will break. The star meme coin is ready to bounce back after a 50% drop. The Fear & Greed Index is at 10, which hasn't happened since 2022. It's the right time to buy, at least on SPOT, as it will make big moves.

DOGE Invest time | BTC | ETH | XRP | TRUMP | LTCDOGE testing 50WMA and Holding
Major Support followed by .17 area
For long term only
may take weeks for gaining profit

Since DOGE is pretty hot at the moment... It's also pretty in the middle of a longer range of price action range with no real reward and a lot of risk to be found at this price point.
You can look at it technical, you can say it's due to politics (like that has always been a solid in the past...), you can blame it on the fomo and the news...
You always have a choice when to act and what to do when you act. Just be smart about it ;-)
Cheers!

DOGE/USDT: Bullish Momentum Building Up🚀 Trade Setup Details:
🕯 #DOGE/USDT 🔼 Buy | Long 🔼
⌛️ TimeFrame: 1D
--------------------
🛡 Risk Management:
🛡 If Your Account Balance: $1000
🛡 If Your Loss-Limit: 1%
🛡 Then Your Signal Margin: $15.42
--------------------
☄️ En1: 0.28242 (Amount: $1.54)
☄️ En2: 0.23477 (Amount: $5.4)
☄️ En3: 0.20084 (Amount: $6.94)
☄️ En4: 0.16692 (Amount: $1.54)
--------------------
☄️ If All Entries Are Activated, Then:
☄️ Average.En: 0.21748 ($15.42)
--------------------
☑️ TP1: 0.48434 (+122.71%) (RR:1.89)
☑️ TP2: 0.57076 (+162.44%) (RR:2.51)
☑️ TP3: 0.6806 (+212.95%) (RR:3.28)
☑️ TP4: 0.82033 (+277.2%) (RR:4.28)
☑️ TP5: 0.9746 (+348.13%) (RR:5.37)
☑️ TP6: Open 🔝
--------------------
❌ SL: 0.07646 (-64.84%) (-$10)
--------------------
💯 Maximum.Lev: 1X
⌛️ Trading Type: Position Trading
‼️ Signal Risk: 🙂 Low-Risk! 🙂
🔎 Technical Analysis Breakdown:
This technical analysis is based on Price Action, Eliot Waves, SMC (Smart Money Concepts), and ICT (Inner Circle Trader) concepts. All entry points, Target Points, and Stop Loss are calculated based on professional mathematics formulas as a result you can have an optimal trade setup based on great risk management.
📊 Sentiment & Market Context:
The DOGE/USDT pair is currently showing strong bullish signals as momentum builds up in the market. With positive sentiment around Dogecoin due to increased social media attention and its growing presence in the crypto space, this pair could see further upside. Technically, key support levels have held firm, and recent price action suggests a potential breakout towards the upside. On the fundamental side, Dogecoin's association with high-profile figures and growing use cases continue to fuel interest, making this a pair to watch closely for potential gains. Keep an eye on volume and price action for confirmation of this bullish trend.
⚠️ Disclaimer:
Trading involves significant risk, and past performance does not guarantee future results. This analysis is for informational purposes only and should not be considered financial advice. Always conduct your research and trade responsibly.
💡 Stay Updated:
Like this technical analysis? Follow me for more in-depth insights, technical setups, and market updates. Let's trade smarter together!
Dogecoin's Bearish Channel Points to 30% Drop, Targeting $0.15Hello and greetings to all the crypto enthusiasts, ✌
In several of my previous analyses, I have accurately identified and hit all of the gain targets. In this analysis, I aim to provide you with a comprehensive overview of the future price potential for Doge coin , 📚💡
Dogecoin is currently situated within a robust descending channel, nearing a significant daily trendline and a strong resistance zone. As previously noted, it has lost several critical support levels, signaling the potential for further declines. I anticipate a minimum 30% drop, with a target price of $0.15. The support levels marked on the chart are based on historical price data and Fibonacci retracements, reinforcing the likelihood of additional downward movement.📚🙌
🧨 Our team's main opinion is: 🧨
Dogecoin is in a strong downtrend, nearing key resistance and a major trendline, and I expect a further 30% drop, with a target of $0.15, based on historical data and Fibonacci levels. 📚🎇
Give me some energy !!
✨We invest countless hours researching opportunities and crafting valuable ideas. Your support means the world to us! If you have any questions, feel free to drop them in the comment box.
Cheers, Mad Whale. 🐋

doge midterm buy"🌟 Welcome to Golden Candle! 🌟
We're a team of 📈 passionate traders 📉 who love sharing our 🔍 technical analysis insights 🔎 with the TradingView community. 🌎
Our goal is to provide 💡 valuable perspectives 💡 on market trends and patterns, but 🚫 please note that our analyses are not intended as buy or sell recommendations. 🚫
Instead, they reflect our own 💭 personal attitudes and thoughts. 💭
Follow along and 📚 learn 📚 from our analyses! 📊💡"

Dogecoin Outlook after the Dip. What to expect NOW?Because of politics and misleading news, we are now witnessing these prices, and this caused most of my analyses to be wrong and not go according to my thoughts. However, now the price has a strong support area that if it reacts to it, the price will go up to $0.26 and create a V pattern. Since this market is filled with some politicians and some Persons & their misleading promises, maybe the price will drop again and go down to $0.17 and then grow again.
Give me some energy !!
✨We spend hours finding potential opportunities and writing useful ideas, we would be happy if you support us.
Best regards CobraVanguard.💚
_ _ _ _ __ _ _ _ _ _ _ _ _ _ _ _ _ _ _ _ _ _ _ _ _ _ _ _ _ _ _ _
✅Thank you, and for more ideas, hit ❤️Like❤️ and 🌟Follow🌟!
❗Disclaimer
⚠️Things can change...
The markets are always changing and even with all these signals, the market changes tend to be strong and fast!!

DOGE update#DOGE is making a descending wedge with 5 elliot waves also its goind down to a demand zone which i think is able to force the market rise again this correction structure is based on the divergence of the last 2 highs in the market check this out

Be careful with DOGE !!!The price drops to around 0.21 and then pumps to 0.29 cents.
and if this wedge is broken, you will no longer see cardano below 23 cents.
Give me some energy !!
✨We spend hours finding potential opportunities and writing useful ideas, we would be happy if you support us.
Best regards CobraVanguard.💚
_ _ _ _ __ _ _ _ _ _ _ _ _ _ _ _ _ _ _ _ _ _ _ _ _ _ _ _ _ _ _ _
✅Thank you, and for more ideas, hit ❤️Like❤️ and 🌟Follow🌟!
❗Disclaimer
⚠️Things can change...
The markets are always changing and even with all these signals, the market changes tend to be strong and fast!!

are we in Bear Market right now ?Good Morning everyone.. I want to say, in this year there is no Alt Season.. we can see second layer like ETH BNB down 20 - 40% from ATH and the third layer like DOGE, SOL already down 0-60%.. How about the last layer or we call meme coin already down 80 - 90% from ATH..
Wdyt about this cycle ?

DOGE 24 hr potterboxesDOGE Doge coin has broken thru the floor of the top box and is now heading for the roof of the lower box. $.19645 , there is still empty space to the left that has to be made up. The boxes are my best guess of whats going to happen. lets hope and pray that it starts to go back up. this could be a buying oppertunity. Happy trading.

DOGEUSDTFrom the perspective of the strong relationship between Elon Musk and the U.S. government, as well as the technical and fundamental analysis of Dogecoin, this trading setup appears highly logical.

DOGEUSDT 1D#DOGE is moving inside a falling wedge and has lost the daily MA200. If it loses the wedge support, it may test the support level of $0.20197 and the ultimate support zone. So, consider placing buy orders there.
Targets are:
🎯 $0.30998
🎯 $0.37154
🎯 $0.45918

Incoming 50% for Dogecoin ??**short term analysis - Days and weeks ahead**
On the above 3 day chart price action has enjoyed a massive 320% rally over the last 2 months thanks to you know who.
A number of reasons now exist to be “short”, despite the myriad of long ideas currently on the platform.
1) Price action prints bearish divergence.
2) Price action was recently outside the Bollinger Band. We know 95% off all price action trades around the mean, which is currently 50% below.
3) Remaining on the Bollinger Band notice the slight inward curve (red arrows)? This is informing you the current extension in price action is now exhausted.
4) Lastly, support and resistance. 20 cents was resistance for multiple months. Healthy market structure would see past resistance confirm as support before the continuation of the uptrend.
Is it possible price action continues upwards and onwards? Sure.
Is it probable? No.
Ww

Bull Meme: Golden BreakthroughThe first meme coin draws a bull flag! You know, it's like finding an undervalued stock in a pile of garbage - rare, but it happens. In the medium term, I expect the growth to 1.618 Fibonacci levels - the golden ratio, friends, nature is not wrong. Plus, a small bullish divergence is coming.
Horban Brothers.

DOGE SELL NOW!!!!!1DOGE took out the sell side liquidity with a retest am looking forward to see price create new lows 0.180 is my main target
JOIN AND ENJOY
