Dogecoin 🚨 Dogecoin at a turning point!
💰 Price is hovering around 0.15842 dollars, moving within a symmetrical triangle. Right at the intersection of dynamic resistance and a descending trendline 📉. A breakout above 0.16643 dollars could pave the way for a rally toward 0.17830 and even 0.19401 dollars 🚀
But if sellers take control and price gets rejected 🔻, supports at 0.14632 and 0.13850 dollars come into play. Further pressure could push it down to the key support at 0.12980 dollars.
📊 With tightening price action and approaching the triangle’s apex, a breakout in the coming days seems likely. The big question: who’s in charge — buyers or sellers? 🤔
📈 Breaking 0.16643 = buyer strength
📉 Rejection = seller dominance
DOGEUSDT_FCD13E trade ideas

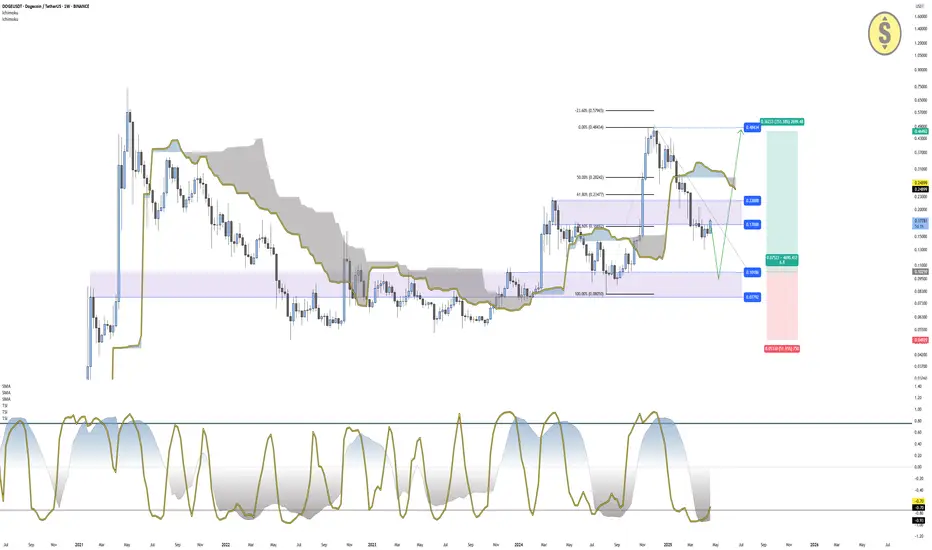
DOGE Weekly Outlook – Long Entry Zones Between 0.10 and 0.07Dogecoin is currently trading around $0.178, after completing a significant retracement of more than 61.8% from the recent rally, suggesting a potential end-of-correction scenario. Price is currently below the Ichimoku cloud (Span A at $0.248, Span B at $0.282), reflecting a short-term bearish context, though longer-term structure remains potentially bullish.
The Trend Strength Index (TSI) indicators are both in oversold territory:
TSI(10): -0.91
TSI(20): -0.93
Historically, these levels on the TSI have often preceded strong reversals during uptrends or after deep corrections.
A break and close above $0.22 would confirm bullish continuation, suggesting that DOGE may be ready to target higher zones, particularly $0.48–0.57, aligning with the 0.0% and -23.6% Fibonacci extension levels.
However, if price fails to break above $0.22, the ideal long entry zone lies between $0.10 and $0.07, a historical high-volume support range, where previous accumulation occurred. A bullish reaction from this zone with renewed TSI momentum could provide one of the best risk-reward setups on this chart.
Trade Setup Summary:
Breakout Confirmation: Above $0.22
Buy Zone (if pullback deepens): $0.10 – $0.07
Targets: $0.48 – $0.57 (prior highs and extension)
Invalidation: Close below $0.07
TSI: Deeply oversold – signaling potential for trend reactivation
DOGE continues to trade as a sentiment-driven asset, often tied to broader crypto momentum and social/institutional interest. While lacking strong fundamentals compared to large-cap projects, it benefits from speculative cycles and has historically seen rapid price expansion after corrections. With Bitcoin stabilizing and broader altcoin interest returning, a technical breakout on DOGE could attract strong inflows, particularly above the $0.22 level.
Disclaimer: This content is for educational and informational purposes only. It does not represent financial advice or a recommendation to buy or sell any financial instrument. Trading involves risk, and you should only trade with money you can afford to lose.
Important support and resistance zone: 0.18951-0.21409
Hello, traders.
If you "Follow", you can always get new information quickly.
Please click "Boost" as well.
Have a nice day today.
-------------------------------------
(DOGEUSDT 1D chart)
The M-Signal indicator on the 1M chart is passing the HA-Low indicator.
Therefore, the A section, that is, the area around 0.18951, is an important support and resistance zone.
-
However, since the HA-High indicator on the 1M chart is formed at the 0.21409 point, it is expected that the uptrend will begin only if the price rises above this point and maintains.
Therefore, we recommend buying when it shows support in the 0.18951-0.21409 range.
-
It is not visible on the current chart, but the HA-High indicator on the 1D chart is formed at the 0.42847 point.
Therefore, if it continues to rise like this, it is possible that it will touch the 0.42847 area.
If not, we should pay attention to whether the HA-High indicator on the 1D chart is newly created.
-
If it does not rise but falls, we should check whether it can rise with support near the M-Signal indicator on the 1D chart.
-
Thank you for reading to the end.
I hope you have a successful trade.
--------------------------------------------------
- This is an explanation of the big picture.
I used TradingView's INDEX chart to check the entire range of BTC.
I rewrote the previous chart to update it by touching the Fibonacci ratio range of 1.902 (101875.70) ~ 2 (106275.10).
(Previous BTCUSD 12M chart)
Looking at the big picture, it seems to have been following a pattern since 2015 and has been rising.
In other words, it is a pattern that maintains a 3-year uptrend and faces a 1-year downtrend.
Accordingly, the uptrend is expected to continue until 2025.
-
(Current BTCUSD 12M chart)
Based on the currently written Fibonacci ratio, it shows up to 3.618 (178910.15).
Fibonacci ratio 0.618 (44234.54) is not expected to fall again.
(BTCUSDT 12M chart)
I think it is around 42283.58 when looking at the BTCUSDT chart.
-
I will explain it again with the BTCUSD chart.
The Fibonacci ratio ranges marked in the light green boxes, 1.902 (101875.70) ~ 2 (106275.10) and 3 (151166.97) ~ 3.14 (157451.83), are expected to be important support and resistance ranges.
In other words, it seems likely to act as a volume profile range.
Therefore, in order to break through this section upward, I think the point to watch is whether it can rise with support near the Fibonacci ratios of 1.618 (89126.41) and 2.618 (134018.28).
Therefore, the maximum rising section in 2025 is expected to be the 3 (151166.97) ~ 3.14 (157451.83) section.
To do that, we need to look at whether it can rise with support near 2.618 (134018.28).
If it falls after the bull market in 2025, we don't know how far it will fall, but considering the previous decline, we expect it to fall by about -60% to -70%.
So, if the decline starts near the Fibonacci ratio 3.14 (157451.83), it seems likely that it will fall to around Fibonacci 0.618 (44234.54).
I will explain more details when the downtrend starts.
------------------------------------------------------

$dogecoin Doge over 70% retracement in falling wedge...$Dogecoin has committed an over 70% retracement from a high of $0.48
Price action is currently in a falling wedge!
Current Price: 0.15
Previous falling wedge yielded a movement of over 400% , just as price found support around the 200EMA.
CRYPTOCAP:DOGE is currently finding support around the 200EMA area and If history repeats then expect previous supports (now resistances) to be tested at levels at 0.27, 0.38, 0.48 - Possibly up to 0.70
#dogecoin idea invalidates under 0.135
My preferred Buy Zone: 0.135-0.175

Dogecoin Breakout Alert: Is a Major Recovery Rally Starting Now?Dogecoin on the Cusp? Analyzing the Potential Breakout and Path to Recovery
Dogecoin (DOGE), the original meme coin that captured the world's attention with its Shiba Inu mascot and community-driven rallies, is once again stirring excitement in the cryptocurrency markets. After a period of consolidation and navigating broader market volatility, DOGE is showing signs of life, prompting speculation about whether a significant upside move could be on the horizon, potentially leading to a more sustained recovery. Recent price action, technical indicators, and optimistic trader sentiment are converging, painting a picture of a coin potentially coiling for its next big move.
Finding Footing: The Bounce from $0.1500
The foundation for the current optimism was laid when Dogecoin successfully defended the $0.1500 support zone against the US Dollar. In volatile markets, establishing clear support levels is crucial. Holding above $0.1500 demonstrated resilience and provided a base from which buyers could initiate a fresh push upwards. Following this defense, DOGE began a "decent upward move," managing to climb above the $0.1550 level.
This initial climb is significant because it signals a shift from purely defensive price action to potentially offensive momentum. Buyers stepped in at a key psychological and technical level, absorbing selling pressure and turning the tide, at least in the short term. The ability to not only hold support but to initiate a bounce suggests underlying demand and interest returning to the meme coin.
Consolidation and Key Technical Signals
Currently, Dogecoin appears to be in a consolidation phase, trading above the $0.1580 level. Consolidation after an upward move is often viewed constructively by technical analysts. It can represent a period where the market digests recent gains, shakes out weak hands, and builds energy for the next directional leg. The key question during consolidation is whether it resolves upwards (a continuation of the prior move) or downwards.
Several technical indicators are lending credence to the bullish case during this consolidation:
1. Trading Above the 100-Hourly Simple Moving Average (SMA): The price remaining above this key short-term moving average is generally considered a bullish sign on hourly charts. It indicates that the average price over the recent past is trending upwards, and the current price is maintaining strength relative to that average. It often acts as dynamic support during pullbacks within an uptrend.
2. Bullish Trend Line: The formation of a short-term bullish trend line with support currently identified around $0.1590 on the hourly DOGE/USD chart is another positive signal. This ascending line connects recent lows and visually represents the current upward trajectory. As long as the price stays above this trend line, the immediate bullish structure remains intact. It provides traders with a clear reference point for potential entry or stop-loss levels.
These technical factors suggest that despite the consolidation, the underlying momentum favors the bulls in the immediate term. The market structure is building higher lows, supported by the trend line and the moving average.
The Resistance Hurdle and Breakout Potential
While the support and short-term indicators are encouraging, the true test for Dogecoin lies in overcoming resistance. The immediate significant hurdle identified is the $0.1650 level. A decisive break and close above this resistance zone would be a strong technical signal, potentially confirming the end of the consolidation phase and the beginning of a more substantial rally. Breaking resistance often triggers further buying activity, including stop-loss orders from short sellers and new entries from breakout traders.
Beyond $0.1650, the next major target highlighted is the $0.2050 resistance zone. Clearing this level would represent a more significant milestone, potentially putting Dogecoin firmly back on the path towards higher valuations seen earlier in the cycle. A move towards $0.2050 would likely require sustained buying pressure and positive sentiment across the broader crypto market.
Trader Sentiment and Bold Predictions
Adding fuel to the speculative fire are optimistic predictions from market participants. Notably, one trader, who reportedly "nailed" a previous 300% rally in Dogecoin, is suggesting that history might be about to repeat itself. While such predictions should always be taken with caution, they reflect a growing bullish sentiment within certain segments of the trading community. These forecasts often rely on pattern recognition, fractal analysis (comparing current price structures to historical ones), and sentiment indicators.
Furthermore, bullish signals are reportedly pointing towards a potential "pump," with some analysts setting longer-term price targets as high as $0.28. Achieving such a target would represent a significant recovery and substantial gains from current levels. This level likely corresponds to previous key resistance or Fibonacci extension levels, representing areas where traders anticipate strong price reactions.
Why the Optimism? Potential Catalysts
Several factors could be contributing to this renewed optimism:
• Broader Market Recovery: Cryptocurrencies often move in tandem, especially Bitcoin and major altcoins. If Bitcoin continues its strength or embarks on a new leg up, it often lifts sentiment across the market, benefiting coins like Dogecoin.
• Meme Coin Season: Historically, periods of market exuberance have seen "meme coin seasons" where highly speculative, community-driven tokens experience outsized gains. Renewed interest in this sector could benefit its leading token, DOGE.
• Community Engagement: Dogecoin boasts one of the most active and vocal communities in crypto. Social media hype and coordinated community efforts can significantly impact its price, especially during positive market conditions.
• Technical Setup: As outlined above, the technical picture (holding support, bullish trend line, potential breakout from consolidation) provides a logical basis for traders anticipating an upward move.
Risks and Considerations
Despite the bullish signals and optimistic forecasts, investing in Dogecoin remains inherently risky and speculative:
• Volatility: DOGE is known for its extreme price swings. Gains can be rapid, but losses can be equally swift.
• Resistance is Real: Failure to break decisively above $0.1650 or $0.2050 could lead to a rejection and a move back down to test support levels, potentially invalidating the bullish setup.
• Market Dependence: A downturn in Bitcoin or the broader crypto market could easily drag Dogecoin down, regardless of its individual technical setup.
• Hype-Driven: Price action can be heavily influenced by social media trends, celebrity endorsements (like those historically from Elon Musk), and general market sentiment, which can change rapidly and unpredictably.
Conclusion: Poised for Potential, Confirmation Needed
Dogecoin currently stands at an intriguing juncture. It has established a solid base of support, initiated an upward move, and is consolidating above key short-term indicators, supported by a bullish trend line. Optimistic traders are eyeing significant upside potential, with targets ranging from $0.1650 and $0.2050 to as high as $0.28, fueled by predictions of repeating past explosive rallies.
However, potential does not guarantee performance. The immediate challenge is converting the current consolidation into a confirmed breakout above the $0.1650 resistance. A successful breach could indeed ignite further buying pressure and set the stage for a move towards $0.2050 and potentially higher, sparking the "full-on recovery" bulls are hoping for. Conversely, failure to overcome resistance could see momentum wane.
For traders and investors, the current situation demands careful monitoring of key levels. While the technical signals lean bullish in the short term, Dogecoin's inherent volatility and sensitivity to broader market conditions necessitate cautious optimism and robust risk management. Whether DOGE is truly about to repeat history remains to be seen, but the current setup has certainly put the beloved meme coin back in the spotlight.


DOGE is very interesting here!DOGE / USDT
Price is setting near a very interesting area for buying after 5 months of bear market
According to this setup .. Prices from 0.16$ - 0.10$ are considered an accumulation zone and could produce a strong rebound
1- Price can jump from here with strong volume any time forming a bull rally
2- However, if price lost the lower trend line (white) it will become bearish again !
Keep an close eye in this zone …

Why Dogecoin Just Reached a MAJOR Price Floor in 2025!Dogecoin (DOGE), the beloved meme cryptocurrency, has just reached a critical demand zone at $0.151—its strongest weekly demand level in years! This key price floor signals a major opportunity for investors, as historical data suggests a strong bullish reaction could follow.

Long trade
Trade Overview: DOGEUSDT Long Position
Entry Price: 0.15701
Profit Target: 0.16355 (+2.95%)
Stop Loss: 0.15520 (–1.16%)
Risk-Reward Ratio: 2.54
🕒 Entry Time: 7:15 PM
📅 Date: Monday, 21st April 2025
🌏 Session: Tokyo PM
The 5-minute timeframe showed a bullish internal structure shift, suggesting a short-term reversal. Additionally, the lower wick rejection indicated buy-stop liquidity being cleared, likely squeezing out early long positions before the true move began.

Can Dogecoin break resistance and soar 40% straight to $0.21?Hello and greetings to all the crypto enthusiasts, ✌
All previous targets were nailed ✅! Now, let’s dive into a full analysis of the upcoming price potential for Dogecoin 🔍📈.
Dogecoin, often hailed as a standout asset of the century, is currently trading within a well-defined descending channel—presenting an exceptional opportunity for long-term investors. A potential 40% upside targets the $0.21 level, contingent upon a confirmed breakout above key resistance and the upper boundary of the channel.📚🙌
🧨 Our team's main opinion is: 🧨
Dogecoin’s in a solid downtrend channel right now, but it’s looking like a great long-term buy with a shot at 40% gains up to $0.21 if it breaks key resistance.📚🎇
Give me some energy !!
✨We invest hours crafting valuable ideas, and your support means everything—feel free to ask questions in the comments! 😊💬
Cheers, Mad Whale. 🐋

DOGE/USDTAfter liquidity is removed in the marked zone, a coin purchase can be considered.
Growth targets:
Target 1 = 0.169
Target 2 = 0.180
Target 3 = 0.205

ALTCOINS | Alt Season | BUY ZONES1️⃣ATOM / BINANCE:ATOMUSDT
Ideal buy zone is the lower area, unless it CLOSES daily candles above the upper area - then the bottom is likely in and chance for lower entry is slim
2️⃣ Litecoin LTC / BYBIT:LTCUSDT
This likely means a longer wait until ideal entry points, weighted heavier towards the lower zones:
3️⃣ Fantom FTM / BITSTAMP:FTMUSD
Seeing a trendline here that should be noted for a likely buy:
4️⃣ DOGE / BINANCE:DOGEUSDT
DOGE price has not yet begun to trade UNDER moving averages in the weekly either, meaning the bearish cycle is still in early days:
DOGE ideal entry for me would be for accumulation, long-term:

DOGEUSDT Broke the resistance wait for flying We are extremely bullish on DOGEUSDT this time and on this phase of bull market we are looking for even new high here after breaking 0.42$ resistance zone the green arrows on chart soon will follow by the chart and price can easily cook next +100% or +200% in upcoming days.
DISCLAIMER: ((trade based on your own decision))
<<press like👍 if you enjoy💚


Dogecoin Still Trading At Bottom Prices (5X Lev. —1665% PP)After the late 2024 bullish cycle, Dogecoin entered a classic correction. This correction started on the 08-Dec. '24 session and ended 07-Apr. '25, support was found in the mid- to late 2024 consolidation range and resistance zone. A classic resistance turned support dynamic, it is not too late.
When looking at this chart, it is easy to see that Dogecoin is still trading at bottom prices compared to the next immediate target and also the last high.
The correction has a perfect 3-3-5 pattern based on a complex ABC, and marketwide action as well as Fibonacci levels predicts its end. Once a correction is over, an impulse always follows, in this case a bullish impulse with 5-up waves, this is perfect.
We are on the verge of maximum bullish momentum and growth. A simple yet strong target, really high probability sits at $0.70 with a target of 333%. When we consider a low risk leverage of 5X, this would give us a total of 1,665%.
If you look at the volume on this chart, notice that there isn't much action lately, not bearish nor bullish, simply no increase in trading volume. This means that it is early for this pair. We know it will move and will definitely do so and bullish, why? Because Bitcoin is going up and many Altcoins are doing the same. What one does, the rest follow.
» Dogecoin is still trading at bottom prices, go for it, it is not too late.
Thank you for reading.
Namaste.

Doge I 3M CLS I KL - Order Block Mode 1 - TP 50%Hey, Market Warriors, here is another outlook on this instrument
If you’ve been following me, you already know every setup you see is built around a CLS range, a Key Level, Liquidity and a specific execution model.
If you haven't followed me yet, start now.
My trading system is completely mechanical — designed to remove emotions, opinions, and impulsive decisions. No messy diagonal lines. No random drawings. Just clarity, structure, and execution.
🧩 What is CLS?
CLS is real smart money — the combined power of major investment banks and central banks moving over 6.5 trillion dollars a day. Understanding their operations is key to markets.
✅ Understanding the behaviour of CLS allows you to position yourself with the giants during the market manipulations — leading to buying lows and selling highs - cleaner entries, clearer exits, and consistent profits.
🛡️ Models 1 and 2:
From my posts, you can learn two core execution models.
They are the backbone of how I trade and how my students are trained.
📍 Model 1
is right after the manipulation of the CLS candle when CIOD occurs, and we are targeting 50% of the CLS range. H4 CLS ranges supported by HTF go straight to the opposing range.
📍 Model 2
occurs in the specific market sequence when CLS smart money needs to re-accumulate more positions, and we are looking to find a key level around 61.8 fib retracement and target the opposing side of the range.
👍 Hit like if you find this analysis helpful, and don't hesitate to comment with your opinions, charts or any questions.
⚔️ Listen Carefully:
Analysis is not trading. Right now, this platform is full of gurus" trying to sell you dreams based on analysis with arrows while they don't even have the skill to trade themselves.
If you’re ever thinking about buying a Trading Course or Signals from anyone. Always demand a verified track record. It takes less than five minutes to connect 3rd third-party verification tool and link to the widget to his signature.
"Adapt what is useful, reject what is useless, and add what is specifically your own."
— David Perk aka Dave FX Hunter ⚔️

Long trade
📈 Buy-side Trade – DOGE/USDT
📅 Date: Sunday, April 20, 2025
⏰ Time: noon – NY Session PM
🔍 Observed Timeframe: 15min
Trade Parameters:
Entry: 0.15300
Take Profit (TP): 0.15452 (+0.99%)
Stop Loss (SL): 0.15277 (–0.15%)
Risk-Reward Ratio (RR): 6.61
🧠 Context / Trade Notes:
Trade executed off a reactive LTF demand zone with a bullish structure shift.
0.382 and 0.618 Fibonacci retracement levels in confluence above.
Entry followed a liquidity sweep + quick recovery, suggesting smart money support.
The tight stop below body/wick support kept risk controlled and allowed for high RR.

DOGEUSDT | One of Today’s Top Volume Gainers – +12.4% in 24h DOGEUSDT has seen a notable surge in trading activity today, with volume up over 12 percent. Despite the buzz, price action remains challenged by key resistance areas.
🔵 Blue Boxes = Strong Resistance Zones
These zones have repeatedly halted DOGE’s advances. Sellers stepped in each time price reached these levels, so we need to respect them.
📉 Short Setup
• Wait for DOGE to rally into a blue box and then show clear weakness on a lower timeframe.
• Confirm with CDV divergence or increased selling volume before entering a short position.
• If price breaks up without giving a proper downward break on the low timeframe, I won’t force a short.
📈 Bullish Shift
• If DOGE manages to clear a blue box with strong volume and then retests it successfully, I’ll flip bullish.
• Entry only once a clean retest holds and lower‑timeframe breakouts confirm buyer strength.
💡 Why You’ll Want to Follow This
I focus on the coins leading in volume because that indicates where the real moves start. Every level I share comes from careful observation and a proven approach—check my profile for the high success rate. Patience, confirmation and adaptability are what keep us ahead. Remember, trade what the market shows you and manage risk wisely.
📌I keep my charts clean and simple because I believe clarity leads to better decisions.
📌My approach is built on years of experience and a solid track record. I don’t claim to know it all but I’m confident in my ability to spot high-probability setups.
📌If you would like to learn how to use the heatmap, cumulative volume delta and volume footprint techniques that I use below to determine very accurate demand regions, you can send me a private message. I help anyone who wants it completely free of charge.
🔑I have a long list of my proven technique below:
🎯 ZENUSDT.P: Patience & Profitability | %230 Reaction from the Sniper Entry
🐶 DOGEUSDT.P: Next Move
🎨 RENDERUSDT.P: Opportunity of the Month
💎 ETHUSDT.P: Where to Retrace
🟢 BNBUSDT.P: Potential Surge
📊 BTC Dominance: Reaction Zone
🌊 WAVESUSDT.P: Demand Zone Potential
🟣 UNIUSDT.P: Long-Term Trade
🔵 XRPUSDT.P: Entry Zones
🔗 LINKUSDT.P: Follow The River
📈 BTCUSDT.P: Two Key Demand Zones
🟩 POLUSDT: Bullish Momentum
🌟 PENDLEUSDT.P: Where Opportunity Meets Precision
🔥 BTCUSDT.P: Liquidation of Highly Leveraged Longs
🌊 SOLUSDT.P: SOL's Dip - Your Opportunity
🐸 1000PEPEUSDT.P: Prime Bounce Zone Unlocked
🚀 ETHUSDT.P: Set to Explode - Don't Miss This Game Changer
🤖 IQUSDT: Smart Plan
⚡️ PONDUSDT: A Trade Not Taken Is Better Than a Losing One
💼 STMXUSDT: 2 Buying Areas
🐢 TURBOUSDT: Buy Zones and Buyer Presence
🌍 ICPUSDT.P: Massive Upside Potential | Check the Trade Update For Seeing Results
🟠 IDEXUSDT: Spot Buy Area | %26 Profit if You Trade with MSB
📌 USUALUSDT: Buyers Are Active + %70 Profit in Total
🌟 FORTHUSDT: Sniper Entry +%26 Reaction
🐳 QKCUSDT: Sniper Entry +%57 Reaction
📊 BTC.D: Retest of Key Area Highly Likely
📊 XNOUSDT %80 Reaction with a Simple Blue Box!
📊 BELUSDT Amazing %120 Reaction!
I stopped adding to the list because it's kinda tiring to add 5-10 charts in every move but you can check my profile and see that it goes on..

Long trade
1Hr TF overview
🐶💰 Trade Breakdown – Buyside (DOGE/USD)
📅 Date: Saturday, April 17, 2025
⏰ Time: 9:00 AM (NY Time)
🪙 Pair: DOGE/USD
📈 Trade Direction: Buy (Long)
Trade Parameters:
Entry: 0.15826
Take Profit (TP): 0.15948 (+0.77%)
Stop Loss (SL): 0.15782 (–0.28%)
Risk-Reward Ratio (RR): 2.77
🧠 Trade Narrative:
A clean scalp trade weekend trade built around:
Momentum continuation after a brief accumulation or a liquidity sweep

DOGECOIN Ready for PUMP or what ?Perhaps this is a cup and handle pattern, and if that's the case, it could push the price up to around 90 cents.
Give me some energy !!
✨We spend hours finding potential opportunities and writing useful ideas, we would be happy if you support us.
Best regards CobraVanguard.💚
_ _ _ _ __ _ _ _ _ _ _ _ _ _ _ _ _ _ _ _ _ _ _ _ _ _ _ _ _ _ _ _
✅Thank you, and for more ideas, hit ❤️Like❤️ and 🌟Follow🌟!
⚠️Things can change...
The markets are always changing and even with all these signals, the market changes tend to be strong and fast!!

DOGEUSDT SHORT TRADE SETUPDOGE is facing strong resistance, with a high probability of a short-term downturn. Other indicators, such as the 50 EMA and trend line, are also signaling similar bearish sentiment.


DOGEUSDT Potetial DownsidesHey Traders, in today's trading session we are monitoring DOGEUSDT for a selling opportunity around 0.17000 zone, DOGEUSDT is trading in a downtrend and currently is in a correction phase in which it is approaching the trend at 0.17000 support and resistance area.
Trade safe, Joe.
