3M CLS I KL - OB I Model 2 I Targe 50% CLSHey, Market Warriors, here is another outlook on this instrument
If you’ve been following me, you already know every setup you see is built around a CLS Footprint, a Key Level, Liquidity and a specific execution model.
If you haven't followed me yet, start now.
My trading system is completely mechanical — designed to remove emotions, opinions, and impulsive decisions. No messy diagonal lines. No random drawings. Just clarity, structure, and execution.
🧩 What is CLS?
CLS is real smart money — the combined power of major investment banks and central banks moving over 6.5 trillion dollars a day. Understanding their operations is key to markets.
✅ Understanding the behavior of CLS allows you to position yourself with the giants during the market manipulations — leading to buying lows and selling highs - cleaner entries, clearer exits, and consistent profits.
📍 Model 1
is right after the manipulation of the CLS candle when CIOD occurs, and we are targeting 50% of the CLS range. H4 CLS ranges supported by HTF go straight to the opposing range.
"Adapt what is useful, reject what is useless, and add what is specifically your own."
— David Perk aka Dave FX Hunter ⚔️
👍 Hit like if you find this analysis helpful, and don't hesitate to comment with your opinions, charts or any questions.
DOGEUSDT_FCD13E trade ideas


Long trade
🟢 DOGEUSDT – Buyside Trade
Date: Sunday, 15th June 2025
Session: Asia Session AM
Time: 6:30 AM
Entry Timeframe: 15min TF
Trade Parameters
Entry: 0.17421
Take Profit: 0.17838 (+2.39%)
Stop Loss: 0.17361 (−0.34%)
Risk-Reward Ratio (RR): 6.95
🧠 Trade Reasoning (Buyside)
DOGEUSDT printed a bullish market structure shift during the early Asia session after a sweep of short-term liquidity beneath the 0.17360 level.

Doge will dodge buyers ?Pattern Observed:
The chart shows a rising wedge that broke to the downside, a bearish continuation pattern.
Price attempted a retest to the wedge's base (marked in red zone), which aligns with lower highs — a strong sign of bearish rejection.
Key Zones:
Red Zone (Supply Zone / Resistance): Around 0.1775–0.1780
Acts as a bearish order block or supply area where price got rejected.
Blue Zone (Demand Zone / Bullish OB): Around 0.1705–0.1720
Anticipated target area where price might find support and possibly bounce.

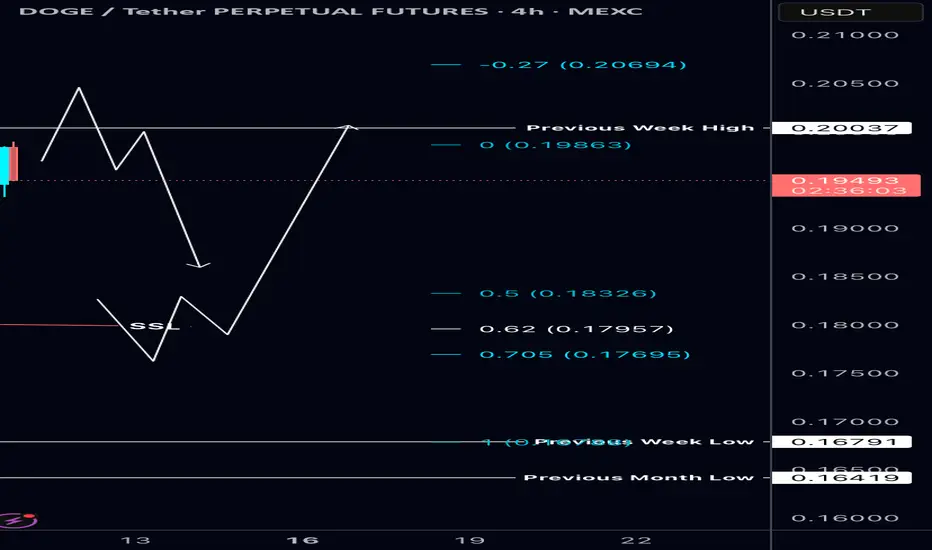
DOGE: A Reversal In Development?Im monitoring for something like this on DOGE with the plan to DCA as it takes SSL and comes into the range low and demand.
Looking a little weak here with signs on majors of weakness, i can see this going into the SSL and lower demand areas marked.
Still seeing this as a large range development and looking for a HTF bullish reversal to form in this region.
Although theres unmitigated demand in the discount below as marked around $0.11, i dont see this targeting that just yet and my main thesis and bias is this potential range and reversal region we are in here.
1D:
3D:
1W:
1M:


Dogecoin Weekly, Bullish Update —1,2,3,4,5 SequenceJust to make sure we have a little bit of everything, here we have Dogecoin sandwiched in-between EMA34 and MA200.
» XRP is trading above these two levels.
» ADA is trading below.
» ETH is trading above.
» BTC is mixed.
Seeing DOGE in-between can reveal a few things.
No drama, MA200 will hold.
MA200 sits at $0.13822.
Notice the drop between December 2024 and March 2025.
Big red candles; straight down.
Notice the more recent drop, between early May and early June.
Small candles and a curve is starting to show already.
What I am gathering from all these charts is that the retrace only has 1-2 weeks left. I say 1-3 weeks just to play it safe, but it seems to be almost over, the bearish action.
Look at this 1,2,3,4,5 sequence.
1) The last peak.
2) The main low.
3) Initial breakout.
4) Retrace and higher low.
5) The next peak.
We are currently at #4. This means that we are set to experience a new wave of growth, "the next peak."
Thanks a lot for your continued support.
Namaste.

You were warned. Now it’s runningThis was the second test into the FVG + 4H OB confluence. High volume candle. Wicking liquidity. And structure still intact.
Why I stayed calm:
Price didn't just drop — it delivered into a known rebalance zone. That 0.176–0.178 box was a magnet, not a mystery.
The reaction came right on cue:
Volume confirmed interest
Structure stayed intact
And the engine kicked in right after the sweep
Now? The play isn’t about guessing the top. It’s about knowing where price is drawn — and why.
Play-by-play logic:
4H OB provided the base
FVG gave the imbalance
Reaction zone created a clean entry
TP target? +18% mapped to 0.21
I didn’t enter on emotion. I positioned based on structure. That’s why it’s already moving while others still think it needs “confirmation.”
Final words:
“You don’t need hindsight when your foresight is built on logic.”


DogeHere is the possibility that i have drew up for the wave.
Horizontal ish dark and light green, buy marks/area
white is the gradual loop around rise
the light green up parrallel is boost growth.
i dont claim to know anything and am just seeing what i hit. along with sharing what my hailmary might be.


Dogecoin, How Far Down Can It Go? Support Confirmed!The retrace is on and Dogecoin is moving lower with a full red candle. The trading day just started and this is truly concerning. As soon as I saw what was happening, bearish momentum growing, I wondered, will the last low (7-April) break or hold?
That's the question I will try to answer.
Since we already looked at the candles and chart structure (lower highs), I looked at the RSI to try and find some clues. Sure, the RSI is already bearish and became really weak 5-June. This is a positive signal because we are looking for signs of a reversal.
Once the RSI becomes weak it immediately starts to turn and the change happens first on the RSI and later the price. This is how you end up with a bullish or bearish divergence on the chart.
For the 7-April low to break, the RSI would have to go into extreme levels, ultra-weak/oversold, but this isn't likely, which means that there is a good chance that the 7-April low will hold.
A support zone is already being tested now which is the 0.618-0.786 Fib. retracement in relation to the April-May wave. While this is a weak support because it is based on the short-term, it is still a support zone and lots of bearish ammunition will be consumed here.
The 7-April low was a peak in September 2024 and also a bigger range from July 2024 (resistance turned support). In October 2024 this level was broken and tested one last time as support before the last bullish wave Dogecoin produced leading to a multi-year high.
In November 2024 again this level was tested on a wick and held nicely.
All in all, this means that we are likely to end with a higher low because this is a very strong support zone. I made it red on the chart.
If the action does move lower, it should only do so briefly on a candle wick. If you are lucky enough to be around when this takes place, you can go all-in at this point and you will be sitting on a great position for the next bullish wave.
Namaste.


DOGE/USD 1H Short-term1. General situation on the chart
Trend: The last few dozen candles show a sideways movement with a stronger upward impulse, which was quickly corrected. We are currently seeing declines after the previous upward wave.
Current price: Approx. 0.1847 USDT.
Last structure: After the upward movement (peak around 0.205), the price dropped quite a bit, now consolidating below 0.19.
2. Formations and structures
Formation:
No clear classic formation (e.g. head-and-shoulders, triangle, flags) on the last candles.
However, something like a local peak ("double top") is visible around 0.203–0.205 — the price touched these areas twice and fell off, which suggests that this is a strong resistance.
Support and resistance:
Support: 0.1800–0.1820 — here is the last local low and the area where the price stopped before the previous upward movement.
Next support: 0.1740–0.1750 — the next low from the previous movements.
Resistance: 0.1900–0.1910 — here was the last consolidation, and then a sharp decline.
Strong resistance: 0.2030–0.2050 (recent highs).
3. Indicators
RSI:
RSI value close to 40 and is heading slightly down, but it is not oversold yet. This may suggest that there is potentially room for further decline.
MACD:
Histogram below the 0 line, MACD line below the signal, the bearish signal is still maintained.
4. Signals and potential scenarios
Base scenario (downside):
If the price breaks below 0.1820, the next target is around 0.1750.
Stop loss in this scenario: above the last resistance, e.g. 0.1910.
Alternative scenario (rebound):
If the price does not break 0.1820, and a demand reaction occurs - we may see an attempt to return to 0.1900, or even to the peaks in the area of 0.2000–0.2050.
Stop loss below 0.1800 (in the case of a long play).
5. Potential targets (by price action):
Short:
TP1: 0.1820 (nearest support, you can take some profit)
TP2: 0.1750 (next low, main target)
Long:
TP1: 0.1900 (nearest resistance)
TP2: 0.2000–0.2050 (highs, if the movement is strong)
Summary
Currently, the chart suggests a bearish scenario.
This is confirmed by the candlestick pattern, negative dynamics and indicators (RSI, MACD).
Key level to watch: 0.1820 – if it falls, we will probably go down to 0.1750.
If there is strong demand for 0.1820, a rebound to 0.19+ is possible.

DOGE 1D: Missed PEPE? Don’t Miss DOGE 06/12/25BINANCE:DOGEUSDT
I’m expecting a continuation of the upward movement and a possible trend reversal.
There’s a chance we’ll revisit the 0.618 Fib level to shake out weak hands — a classic move before liftoff.
Looking at the chart, it really feels like altseason is closer than anyone expects. DOGE may lead the charge.
Entry Points (EP):
• Market
• $0.19357
• $0.18009
Take Profit (TP):
• $0.22787
• $0.25439
⚠️ My personal opinion only — not financial advice.
Do your own research and remember: all actions you take are your own responsibility. Practice solid risk management and avoid investing more than 2% of your total capital per trade.
DYOR.


DOGEUSDT Massive pump!!!As we can see market is in range zone now and price is still in descending channel and still receiving range and correction and kicking out the sellers.
But soon after breakout of channel uperside and above 0.25$ resistance price will pump hard and non stop to the targets mentioned on chart.
DISCLAIMER: ((trade based on your own decision))
<<press like👍 if you enjoy💚

doge buy long term "🌟 Welcome to Golden Candle! 🌟
We're a team of 📈 passionate traders 📉 who love sharing our 🔍 technical analysis insights 🔎 with the TradingView community. 🌎
Our goal is to provide 💡 valuable perspectives 💡 on market trends and patterns, but 🚫 please note that our analyses are not intended as buy or sell recommendations. 🚫
Instead, they reflect our own 💭 personal attitudes and thoughts. 💭
Follow along and 📚 learn 📚 from our analyses! 📊💡"

Dogecoin Bearish But...Yes, Dogecoin is bearish now but this is only a short-term situation, it is the end of a long-term correction. Notice the chart, Dogecoin has been producing lower highs long-term, since December 2024.
Recently, there was a major low in April and then a recovery and after this recovery we have local lower highs. The current drop is the continuation of the retrace that started 11-May. This retrace should end soon, within weeks or just a few days.
As soon as the low settles, we can enter the market bullish again. If you trade spot, simply wait. Day traders can easily SHORT but the range is short, after a small drop cover and switch back to LONG. Experts only.
That's the scenario. We are very likely to get a higher low compared to 7-April. If too many leveraged positions are open though and the market wants to remove those, there can be a long wick that pierces support for the action to recover the next day.
So, the drop can be fast, can be small, can be hard, can be easy or it can be short, it doesn't matter, once it is over, Dogecoin will continue to grow.
Patience is key.
Thanks a lot for your continued support.
Namaste.

Technical Analysis for Dogecoin (DOGE/USDT) – Daily Chart
🔍 Current Price Action:
Current Price: 0.19892 USDT
The price is reacting positively from a key support zone (highlighted with circles), indicating a strong bounce and potential for upward continuation.
📈 Target Resistance Levels:
0.20302 USDT – First short-term resistance, may be tested soon.
0.23355 USDT – Intermediate resistance; a key breakout level.
0.26690 USDT – Major resistance; target if momentum remains strong.
🧠 Technical Insights:
Pattern Observation: A double bottom-type reaction from support suggests bullish reversal.
Projected Gray Candles: Show a potential bullish scenario toward the next resistances.
Trend Outlook: Bullish bias remains as long as the price holds above the 0.185 area.
✅ Strategy Suggestion:
Entry Zone: Between 0.195 – 0.200 USDT (after confirmation of support hold)
Take Profits:
Target 1: 0.203
Target 2: 0.233
Target 3: 0.266
Stop Loss: Below 0.180 (to protect against failed support)
📌 Summary:
A strong bounce from a confirmed support zone gives DOGE potential for a continued rally toward 0.23–0.26 if the current momentum is maintained.

Dogecoin (DOGE): Getting Ready For Buyside Movement | $0.44Dogecoin is repeating its pattern where, after forming local lows and the first breakout above EMAs, the price is not getting ready for a proper push, it seems to us.
We are monitoring for the EMA line here, as once we see a proper break (the second one), we will be aiming for the $0.44 area.
Swallow Academy

DOGEUSDT BINANCE:DOGEUSDT Price is ranging between 0.18200 and 0.18650 dollars after a sharp rise from 0.17000. A break above 0.186 triggers a buy, targeting 0.19450 and 0.19950 dollars. A break below 0.182 triggers a sell, with supports at 0.17650 and 0.17000 dollars.
Trigger Levels:
Buy Trigger: 0.186
Sell Trigger: 0.182
⚠️Contorl Risk management for trades.

Doge bearish in 1hr time frameThe pattern is not yet complete, but if it makes a new bounce and retests again, it will attract bearish traders, increasing the likelihood of a breakdown. A close below 0.1865 on the 1-hour timeframe will confirm the pattern. This level also serves as the invalidation point for long entries and the final take-profit (TP) from the previous bearish pattern.
Targets are 0.174 and 0.167.
