DOGE on a ROLL! DOGE on a roll? Want to roll? LEts roll where is it and where and what can happen is stated . this darn goes 0.35 the momentum of the drawing or doodle sheds apart.
DOGEUSDT_FCD13E trade ideas

UPDATE: Dogecoin unchanged! January 2025 major movements!UPDATE: Dogecoin unchanged! January 2025 major movements for crypto's!

Dogecoin same! From January 2025 we will see major movements.Dogecoin same! From January 2025 we will see major movements.

Dogecoin (DOGE): Possible Selling Zones!Dogecoin seems to go for a possible re-test towards the upper zone of resistance.
This is the zone we will be switching our attentions on once we reach it, where we will be looking for a possible rejection from there (a successful re-test).
Another possible case would be that we would see a straight dump on the markets upon coming close to New Year so stay safe and minimise the risk while trading!!
Swallow Team

DOGE Targets!COINEX:DOGEUSDT It has risen 340% since the day it was signaled.
Now you can buy on red supports for future targets.
If Bitcoin corrects to the $78,000-$80,000 range, Dodge can also correct to the 0.16 support.
Don't forget to follow, boost and comment

"Analyzing Dogecoin's Path to $10: Potential for the 25 BullRunAt the time of writing, Dogecoin sits at 0.0255. When applying the RSI with Dogecoin at 65.72, this means Dogecoin is overbought and some correction needs to happen before realistic projected gains in 2025 can occur.
Final thoughts are: Investment Assessment and Conclusion: Dogecoin can go to $10 in 2025—just not anytime soon, but eventually. But it needs project developments to be effectively completed and the price floor most crucially, around $2.00. Thus, for a $10 Dogecoin to happen, some investors need to HODL and some investors need to take profits during the bull run for price support. The RSI is currently at 40.92, which means it's teetering on the edge of oversold but also stabilizing, which points toward a bit of consolidation before a breakout on these ranges.
Key Resistance Levels: $0.39 to $0.47: Short-term resistances that need to be breached in order for upward momentum to continue. $0.59: Major psychological/technical resistance that will need to be maintained to render any subsequent significant/exponential growth. $0.73: Resistance against previous all-time highs; breaching this will allow for exponential growth.
Macro Considerations: Market Sentiment: Bull run in 2025 reliant on macroeconomic factors and overarching crypto adoption. DOGE CATALYSTS: Musk's ongoing involvement and potential application on X down the line, additional application with other sites or as a payment method, community buy-in and meme use.
DOGE GROWTH REQUIREMENTS: In order for DOGE to grow naturally in value to the $10 price target, it needs a market cap over such price, which means billions, if not trillions of dollars need to be infused into the crypto world with Dogecoin having the same market cap or larger.
FINAL THOUGHTS: The $10 price target requires so much bullish sentiment even based on Dogecoin trading in millionths of cents. It requires an ongoing bullish trend for the foreseeable future. Unheard of bullish derivatives season and retail/institutional participation macro market/fundamentals monitor. Bullish progression: Entire resistance lines on the chart have been breached. Because for something like this to occur, it has to be an extraordinarily bullish, extremely engaged retail and institutional lineup plus macro market/fundamentals. People need to be in the know and paying attention to breakout levels and macro developments in the months to come.

DOGE - Downtrend Before Rally (?)DOGE TF 1W seems to have a repeated pattern where a consolidation happened before the rally occur.
However, this outlook may also be wrong by considering the following altseason in the near future.
#NFA #DYOR
Feel free to discuss.


DOGE ON DEMAND FLOOR AND POSSIBLE UPSWING ON SENTIMENTSHAVYFXHUB strategy applicable to anything tradable in the financial market,
doge after breakout of weekly ascending trendline ,retested and rejected 0.2699 as new demand floor after break of supply roof .
price will continue to upswing based on sentiment and market structure.
on higher zone two strong weekly candle broke a demand floor which has multiple weekly candle rejection on our trend angle. Retest is likely ,but liquidity grabs from 0.5 level is possible before selling to respect the broken demand floor.
but weekly candle break and close above supply roof invalidate our retest ideas ,indicating that buyers are going long.
caution; be careful and wait for weekly candle close for clear directional bia

Dogecoin to the galaxydogecoin to pick up steam, it has teasted the weekly 50% retracement level and it's ready to ride the rocket to the moon, look for a strong 4h bullish candle, buy and hold some of this lady, we may not see this price again in the next 6 months. happy trading.
risk only what you can lose.

Possible move for Dogeusdtgood zone for support and going up for DogeUSDt
this zone is on Static Supprt level

Dogecoin UpdateDogecoin is forming a descending channel nut still isn't a valid channel still waiting for the 3rd touch to form
what do you think this pair will form the 3rd touch and then give us a Double Bottom so we can be searching for a long to target a new High???
Share your thoughts with us
Follow us for more

DOGE/USDT Chart Analysis and Trade Setup.DOGE/USDT has broken out of the symmetrical triangle pattern, indicating a potential bullish continuation.
The breakout is accompanied by continued price action above the key moving averages, reinforcing the bullish setup.
DOGE trades above the 50-EMA and 200-EMA, which converge and may act as dynamic support, reinforcing the upside momentum.
Trade Strategy:
Entry Zone: Around $0.31633 after confirmation of the breakout.
Stop Loss: Below $0.30699 for a failed breakout.
Take Profit Level:
Primary Target (TP): $0.37545 (highlighted resistance area)
The breakout from the symmetrical triangle indicates bullish potential. The trade setup offers a favorable R: R ratio and significant profit potential as long as the price stays above the breakout level and the stop-loss is respected.
#DOGE #CryptoTrading #TradeSetup
DYOR, NFA
@Peter_CSAdmin

Daily USDT Time DodgeI expect the price to complete its rotation from the specified time and proceed according to the specified schematic

DogecoinDoge usdt analysis
Time frame 4hours
Risk rewards ratio > 1.7 👈👈👈 for short time
Doge move up and down slowly in blue rectangle which you can see in the chart
Here is a good entrance situation to trade

doge long midterm"🌟 Welcome to Golden Candle! 🌟
We're a team of 📈 passionate traders 📉 who love sharing our 🔍 technical analysis insights 🔎 with the TradingView community. 🌎
Our goal is to provide 💡 valuable perspectives 💡 on market trends and patterns, but 🚫 please note that our analyses are not intended as buy or sell recommendations. 🚫
Instead, they reflect our own 💭 personal attitudes and thoughts. 💭
Follow along and 📚 learn 📚 from our analyses! 📊💡"

The key is whether it can rise above 0.37778
Hello, traders.
If you "Follow", you can always get new information quickly.
Please click "Boost" as well.
Have a nice day today.
-------------------------------------
(DOGEUSDT 1W chart)
As the price falls, the HA-High indicator is expected to be created at the 0.37778 point.
Accordingly, the key is whether it can rise above 0.37778.
If not,
1st: 0.26850-0.28000
2nd: M-Signal on the 1M chart
You need to check whether it can rise with support near the 1st and 2nd above.
-
Since the StochRSI indicator has fallen below the overbought level, it seems likely to continue to decline further.
However, when looking at the StochRSI indicator, volatility may occur when it reaches around the 50 point, so caution is required.
-
(1D chart)
-
Thank you for reading to the end.
I hope you have a successful trade.
--------------------------------------------------
- Big picture
I used TradingView's INDEX chart to check the entire range of BTC.
(BTCUSD 12M chart)
Looking at the big picture, it seems to have been maintaining an upward trend following a pattern since 2015.
In other words, it is a pattern that maintains a 3-year upward trend and faces a 1-year downward trend.
Accordingly, the upward trend is expected to continue until 2025.
-
(LOG chart)
Looking at the LOG chart, you can see that the upward trend is decreasing.
Accordingly, the 46K-48K range is expected to be a very important support and resistance range from a long-term perspective.
Therefore, we expect that we will not see prices below 44K-48K in the future.
-
The Fibonacci ratio on the left is the Fibonacci ratio of the uptrend that started in 2015.
In other words, it is the Fibonacci ratio of the first wave of the uptrend.
The Fibonacci ratio on the right is the Fibonacci ratio of the uptrend that started in 2019.
Therefore, it is expected that this Fibonacci ratio will be used until 2026.
-
No matter what anyone says, the chart has already been created and is already moving.
How to view and respond to this is up to you.
When the ATH is updated, there are no support and resistance points, so the Fibonacci ratio can be used appropriately.
However, although the Fibonacci ratio is useful for chart analysis, it is ambiguous when used as support and resistance.
This is because the user must directly select the important selection points required to create Fibonacci.
Therefore, since it is expressed differently depending on how the user specifies the selection points, it can be useful for chart analysis, but it can be seen as ambiguous when used for trading strategies.
1st : 44234.54
2nd : 61383.23
3rd : 89126.41
101875.70-106275.10 (Overshooting)
4th : 134018.28
151166.97-157451.83 (Overshooting)
5th : 178910.15
-----------------

DOGE/USDT Weekly Chart Analysis $DOGE/USDT Technical Analysis
Current price : 0.34839 USDT.
Support: Best zone at 0.26430 USDT, secondary support at 0.18226 USDT.
Resistance/Targets:
T1: 0.415 USDT.
T2: 0.547 USDT.
T3: 0.7 USDT.
Buy near support levels, aim for the targets, and manage risks with stop-loss orders below 0.26430 USDT.

$DOGE Next Target 0.7$➡️ CRYPTOCAP:DOGE Next Target 0.7$
Zone Long :
1) 0.28$
2) 0.20$
Target :
1) 0.41$
2) 0.52$
3) 0.70$
ST : 0.15$

Nobody appreciates it !!!The price is within an ascending wedge and this can be a bullish signal for Dogecoin. However, we need to wait for this wedge to be broken and then wait for the price to rise. Currently, the price can be bearish because more funds have been injected into Bitcoin to allow Bitcoin to find more stability in the coming days.
Give me some energy !!
✨We spend hours finding potential opportunities and writing useful ideas, we would be happy if you support us.
Best regards CobraVanguard.💚
_ _ _ _ __ _ _ _ _ _ _ _ _ _ _ _ _ _ _ _ _ _ _ _ _ _ _ _ _ _ _ _
✅Thank you, and for more ideas, hit ❤️Like❤️ and 🌟Follow🌟!
⚠️Things can change...
The markets are always changing and even with all these signals, the market changes tend to be strong and fast!!

DOGE Spot Buys/ LongDoge spiraled downwards towards support 0.35600. It tried to hold support but failed.
Now next Support is @ 0.21900 if doge went down to that level and fails to close below it you can spot buy / long with target @ 0.34500
If doge recovers and closes above resistance @ 0.35700 than Spot buy / long with target @ 0.47000.
It’s holiday season so trade cautiously. Plus my advice is that try to do analysis and trade on daily or 4 hr tf crypto respects s/r levels on htf. Only trade on ltf if you want to do scalping.

doge update i dont listen to news or politics I READ the charts and its telling me we will see a lower low to my followers dont listen to the news read the charts ABC is still a valid this ABC .pattern invalid if we hit 0.37-36,but i believe we will on go lower form now on we should see lower lows to validate abc correction
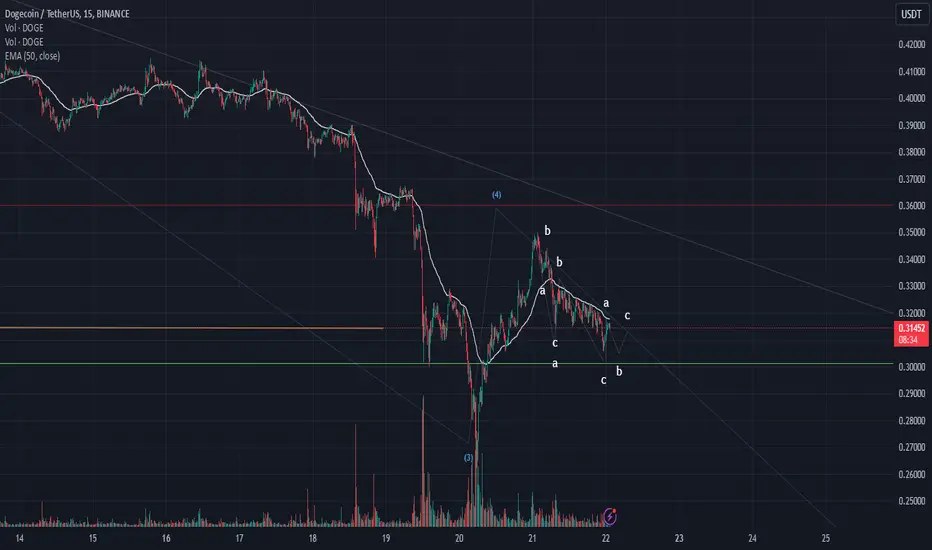
doge updateABC correction looks good if we can brake down thru resistance of 0.29 we most likely to brake down to lower support levels and bonce off with a bullish wick.
