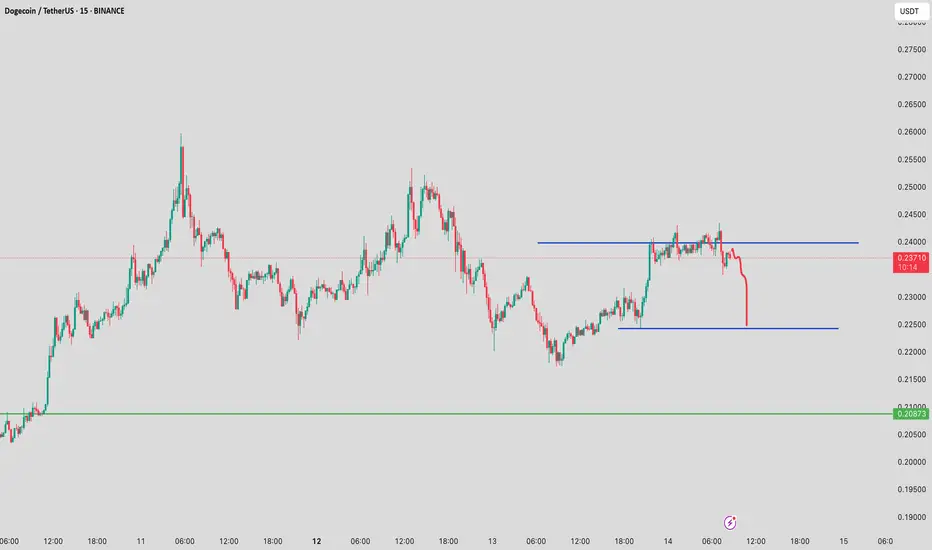
Dogeusdt forming a small Bullish iH&S pattern in 1hr tfA bullish inverse Head and Shoulders (iH&S) pattern is forming. A close above 0.2294 on the 1-hour timeframe may activate the pattern.
Consider an entry between 0.2248 and 0.2294, assuming a breakout occurs without breaking the previous swing low.
The targets are 0.239 and 0.245.
Assuming the breakout happens, the price may revisit the liquidity sweep area afterward due to tight consolidation, potentially fueling further upward movement.
Therefore, it is advisable to wait for confirmation and a bounce at the liquidity sweep area before entering.
DOGEUSDT_FCD13E trade ideas

DOGE/USDT: Key Buy Opportunity at 0.22800 Support Zone!Hey Traders, in today's trading session we are monitoring DOGE/USDT for a buying opportunity around 0.22800 zone, DOGE/USDT is trading in an uptrend and currently is in a correction phase in which it is approaching the trend at 0.22800 support and resistance area.
Trade safe, Joe.

dogeusdt.15mAnalysis of the dogeusdt pair on the 15-hour time frame. The analysis is based on trend analysis, support and resistance. What we are waiting for is the achievement of bullish conditions.

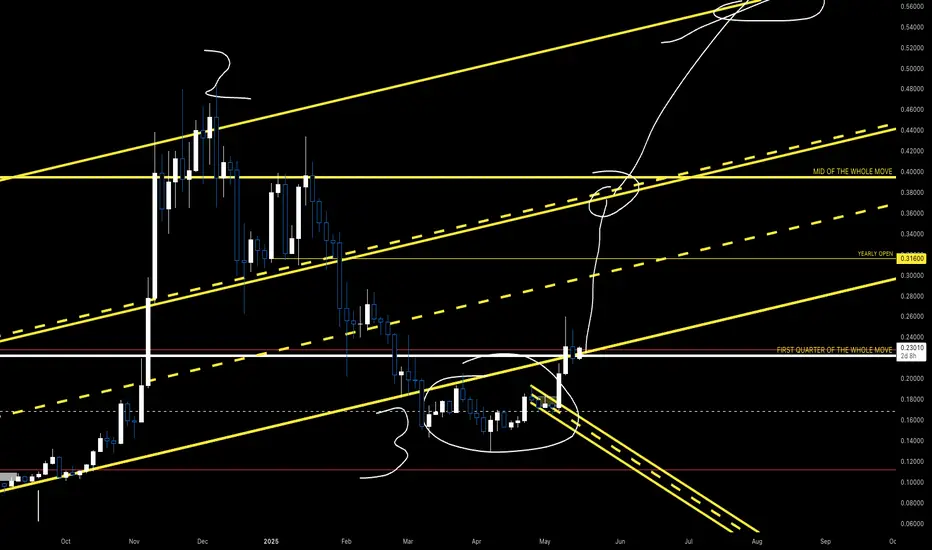
DOGEParallel channel defines uptrend.
1 (bottom) and 3 (pullback to support) never move.
2 is variable and can be adjusted vertically depending on extension.
The circled region after 3 (where DOGE has traded since February) can be thought of as a deviation of support or deviation of the lower bound of the channel, the bankers creating an opportunity for themselves to steal as much as possible at discounted prices.
Once back inside the channel, I believe the accumulation will be done.
Inevitably, we will run the other side of the this channel.

DOGE to $0.31 — Closer Than You Think !
Hello Traders 🐺
This is a quick update on my previous DOGE idea.
So if you're currently in a long position on DOGE based on my last analysis, this one will probably help you stay on track and clear the path forward.
But before we begin, let’s quickly revisit my previous DOGE idea — especially for those who haven't seen it yet — just as a reminder of how things were expected to play out:
As you can see, DOGE is currently trading above the resistance box and forming a bull flag on the 4H timeframe.
If price breaks above the flag’s resistance line, the next target would be around the 1.0 Fibonacci level at $0.31.

dogeusdtdogeusdt may show some rally in next 2 days . it may come to form shoulder and probably complete inverse head and shoulders

DOGE LONG TRADE SETUPDOGE is currently holding at a strong support zone , with a high probability of an upward price move. Additionally, the 50 EMA is providing strong support during the retest.

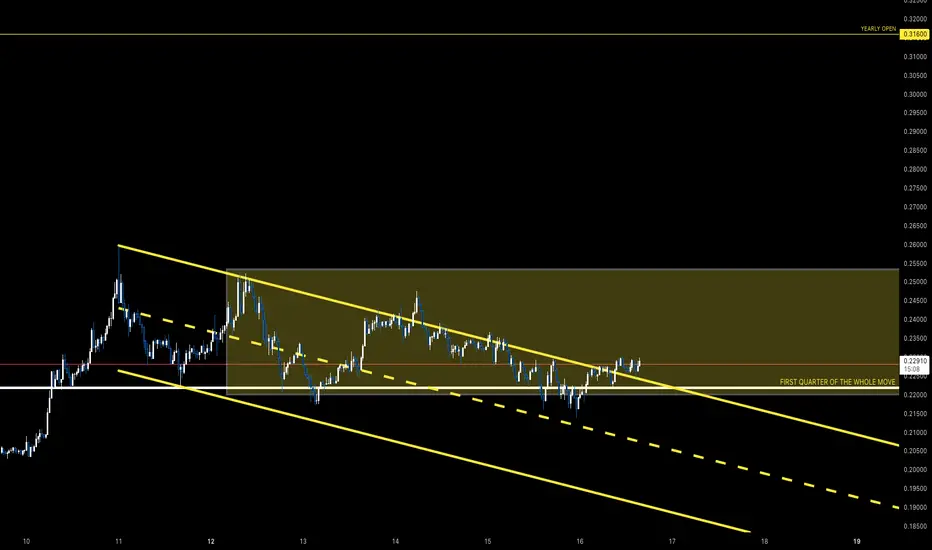
Short DOGEUSDT With Confidence – Bearish Setup + Targets🔍 Technical Analysis Summary
Pattern: Bearish Flag (Bearish Continuation)
Resistance Zone: Around 0.25945 USDT
Price Channel: Price is consolidating inside a descending flag channel after a sharp upward move.
Potential Breakdown: If price breaks below the lower trendline of the flag, continuation to the downside is expected.
📉 Trade Setup (Short Position)
Entry Point: Around 0.22534 USDT (at or just below the flag's lower trendline to confirm breakdown)
Stop Loss: Around 0.23581 USDT (above the upper flag boundary for invalidation)
Take Profit Targets:
o TP1: 0.20573 USDT (first strong support zone)
o TP2: 0.18691 USDT (second strong support zone)
✅ Risk-Reward Ratio Analysis
Entry: 0.22534
Stop Loss: 0.23581 → Risk: ~1.05 cents
TP1: 0.20573 → Reward: ~1.96 cents → RR ≈ 1.86:1
TP2: 0.18691 → Reward: ~3.84 cents → RR ≈ 3.66:1
📌 Conclusion
This bearish flag setup on DOGEUSDT presents a strong opportunity for a short position. A confirmed breakdown below the flag pattern could lead to a test of the strong support zones marked. It's a good setup with a favorable risk-reward ratio, especially if TP2 is reached.

Be careful with DOGE !!!So if you pay attention to the DOGE chart you can see that the price has formed a Ascending FLAG or DOGE which means it is expected to price move as equal as the measured price movement.( AB=CD )
NOTE: wait for break of the FLAG .
Give me some energy !!
✨We spend hours finding potential opportunities and writing useful ideas, we would be happy if you support us.
Best regards CobraVanguard.💚
_ _ _ _ __ _ _ _ _ _ _ _ _ _ _ _ _ _ _ _ _ _ _ _ _ _ _ _ _ _ _ _
✅Thank you, and for more ideas, hit ❤️Like❤️ and 🌟Follow🌟!
⚠️Things can change...
The markets are always changing and even with all these signals, the market changes tend to be strong and fast!!

DOGECOIN. USDTGiven the positive divergence, on the 4-hour time frame we can predict an uptrend.
First to point A
Then, if we exit the channel, we will see higher targets.
So,
Buying a step may be appropriate. then wait for a breakout of the channel.
Or wait until it breaks out of the channel and then buy.
It may be better to buy before point A.

DOGE/USDT 1H Chart: Double Top or Expanding Triangle in Play?Dogecoin is serving up some spicy setup!
We’re seeing a Double Top pattern forming, with DOGEUSD currently at $0.22 — right at the bottom line of this bearish formation. The two peaks hit resistance around $0.25 , signaling potential downside.
However, if DOGEUSDT drops to the key support at $0.20 , this pattern could evolve into an Expanding Triangle (Megaphone) , which might set the stage for a bullish reversal!
I’m eyeing a long entry at $0.20 .
If DOGE holds this level and breaks above the Double Top resistance at $0.25 , we could see a surge toward $0.27 and beyond!
On the flip side, a break below $0.20 could lead to further downside, possibly testing $0.18 .
Key Levels to Watch:
Resistance: $0.25 (Double Top resistance), $0.27
Support: $0.20
Breakout Target: $0.27+
Breakdown Risk: $0.18
Will DOGE bounce from $0.20 and rally, or are we in for a deeper dip? Let’s hear your thoughts below!

Dogecoin Long-Term, Weekly TimeframeRepeating patterns are great because you can easily predict the future by studying them.
Good...
Dogecoin produced a peak in March 2024 and starts a decent. This descent creates a sequence of lows marked 1,2,3 on the chart. This ends up as a rounded bottom. As soon as the action recovers above the baseline of the rounded bottom, there is some consolidation and then massive growth. The highest prices in several years. The situation is very similar today.
Dogecoin produced a peak in December 2024 and then starts a descent. This descent creates the bottom pattern shown on the chart. The market is already bullish as all the bearish action since February has been removed. DOGEUSDT moves now as if it were February 2025. March and April where the months that produced the final market shakeout (flush) before the 2025 bull market cycle and wave.
Right now we can see some consolidation based on the weekly timeframe, very short, followed by additional growth. The biggest wave since 2021. Something awesome.
Are you ready?
I hope you are...
Namaste.

DOGE (Dogecoin)–Pullback Opportunity Amid Market-Wide ResistanceWith the total crypto market cap stalling at a major resistance zone, many altcoins — including DOGE — are due for a healthy retracement after recent strong moves. This sets up a potential buy-the-dip opportunity as DOGE returns to key support near $0.20.
🔹 Entry Zone:
$0.20 (next major support zone after recent rally)
🎯 Take Profit Targets:
🥇 $0.23 – $0.24
🥈 $0.30 – $0.31
🛑 Stop Loss:
Just below $0.18 (invalidates the support-based long idea)


DOGECOIN CONSOLIDATION - When Breakout?CRYPTOCAP:DOGE has been seen to range within the box on the 1hr timeframe chart since 10th May and it’s still within the box. Trade with caution.
Please support this idea with a LIKE👍 if you find it useful🥳
Happy Trading💰🥳🤗

Dogecoin Buy Signal: Will the Channel Break Today?Hello friends
Given the good growth we had, you can see that the price has taken a break, which can be used as a buying opportunity.
We have identified the buying steps for you to buy in steps and move to the specified goals.
*Trade safely with us*

DOGE/USDT 1D chart reviewHello everyone, let's look at the 1D dog chart to USDT, in this situation we can see, the price reflection here can be seen how the price continues under the downward trend line.
Going further, let's check the places of potential target for the price:
T1 = 0.246 $
T2 = 0.282 $
Т3 = 0.319 $ t4 = 0.369
Let's go to Stop-Loss now in case of further declines on the market:
SL1 = 0.229 $
SL2 = 0.195 $
SL3 = 0.157 $
Looking at the RSI indicator, you can see that when the indicator came out the top, it gave the relief for the price and now when the price lasts in a slight side trend, the indicator collects energy for a new move.

dogeusdtTechnical analysis of the dogeusdt pair on the half-hour timeframe, based on trend analysis and support and resistance. The bullish scenario is currently the strongest.

Dogecoin Surges From Key Support — Is $0.19 the Launchpad ?Dogecoin has shown renewed strength with a powerful bounce off the $0.16 support zone, a level that has acted as a crucial pivot in the past. This move has officially shifted the short-term market structure, flipping from bearish to bullish after weeks of downward pressure. Now, traders are closely watching the $0.19 region, which holds the key to sustaining this momentum.
Key Technical Points:
Market Structure Flip: DOGE breaks higher from $0.16, setting a bullish tone
$0.19 Critical Zone: Confluence of 0.618 Fib and value area high
Potential Expansion: Break and hold of $0.19 could mimic previous explosive rallies
Detailed Analysis:
The recent impulse in Dogecoin’s price action has flipped the market structure bullish after holding the vital $0.16 level. This level served as a springboard for past major expansions, and its strength has once again proven essential to DOGE’s technical resilience.
With this structure shift in place, the focus now turns to $0.19 — a key zone that is stacked with technical confluence. Not only does this level represent a high-volume node (value area high) from the recent downtrend, but it also aligns with the 0.618 Fibonacci retracement, making it a strong area for a potential bullish retest.
A successful hold and bounce from $0.19 would signal confidence in the new bullish structure and likely trigger increased demand from breakout traders. Historically, when Dogecoin consolidates and then breaks through such levels, it often results in a sharp expansion move — sometimes even toward previous all-time highs.
Although this breakout hasn’t happened yet, the setup is taking shape. The price will need to hold above $0.19 and ideally see an influx of volume to validate any upside continuation. If these criteria are met, a strong rally could follow.
What to Expect in the Coming Price Action:
If Dogecoin can retest and hold $0.19 with strength, expect continuation toward $0.23 and possibly beyond. This confluence zone is critical — and could be the launchpad for DOGE’s next explosive leg upward.

DOGE | HTF ANALYSIS
Fundementals :
DOGE started as a meme coin, but evolved into a serious digital
asset with strong community backing, low transaction fees, and high liquidity.
It's based on the Proof-of-Work mechanism (like Bitcoin) but with faster block times and unlimited supply
Backed by Elon, One of the few memes that is mentioned regurarly by Musk,
Strong Meme Culture + community,
DOGE likely won’t lead in tech, but it’s almost guaranteed to lead in meme-fueled pumps.
Technicals :
Nice entry for now most likely we retest Liquidity Pool resting @ 0.20269making it a strong Buy wall for price to extend higher,
Healthy retest of the Previous Structure Shift / break
DCA / TARGETS
No need to DCA let the intial position
playout while aiming :
0.33417 - 0.39422 - 0.47600
