#DOGE Update #1 – July 21, 2025#DOGE Update #1 – July 21, 2025
Dogecoin has made healthy retracements after both of its last impulsive moves, maintaining a technically sound structure. I took a profit yesterday but didn’t share it due to higher risk.
Now, I've opened the Long position visible in the chart because I believe DOGE is targeting the second leg of this impulsive move, aiming for the $0.29 zone. I’m expecting approximately 6% gain from this setup.
The trend remains bullish, and pullbacks have been met with solid support, giving this trade a high probability of continuation. That said, always be cautious with sharp volatility.
DOGEUST trade ideas

DOGE Swing Trade – Key Support in PlayDOGE is currently holding a major support zone, offering a strong risk-reward opportunity for a long swing position. With bullish sentiment and meme coin narratives returning, this level is worth watching for upside continuation.
📌 Trade Setup:
• Entry Zone: $0.23 – $0.24
• Take Profit Targets:
o 🥇 $0.27 – $0.28
o 🥈 $0.37 – $0.44
• Stop Loss: Just below $0.215


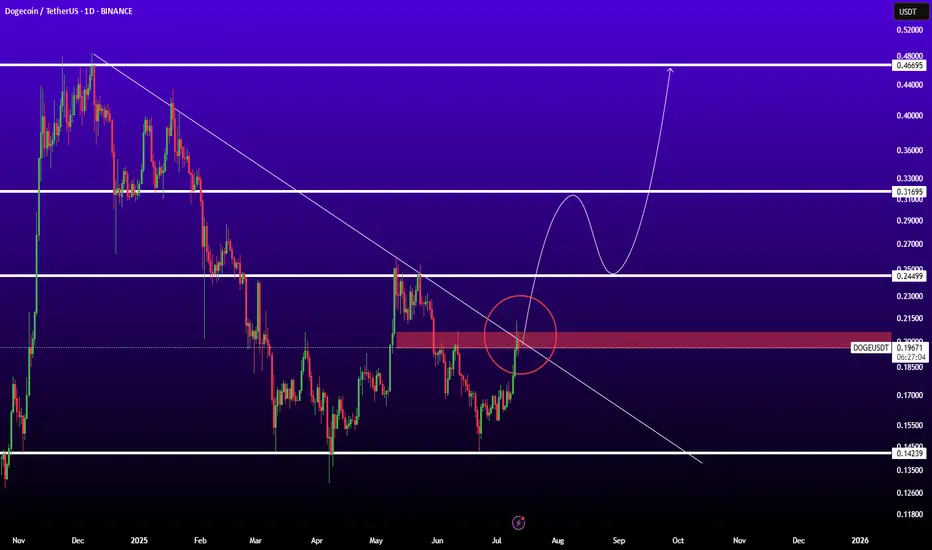
DOGEUSDTBINANCE:DOGEUSDT is in good level for pump because if breaked trendline and resistance 0.200$ ready for sharp movement to next levels.
Resistances: 0.25 - 0.32 - 0.45
Support: 0.15
DOGE – Strong Uptrend Confirmed by Aroon Indicator
DOGE is flashing a powerful bullish signal, with its Aroon Up indicator reading a perfect 100%. The Aroon indicator helps identify the strength and direction of a trend by tracking how recently price has made new highs or lows. A 100% Aroon Up reading means that the most recent highs are happening consistently within each period of the indicator’s lookback window.
Currently, DOGE is trading at price levels last seen in February, and the persistent new highs confirm a strong and steady uptrend. This setup suggests bullish momentum is not only intact but accelerating, as DOGE continues to push into higher territory with each candle.
Ask ChatGPT

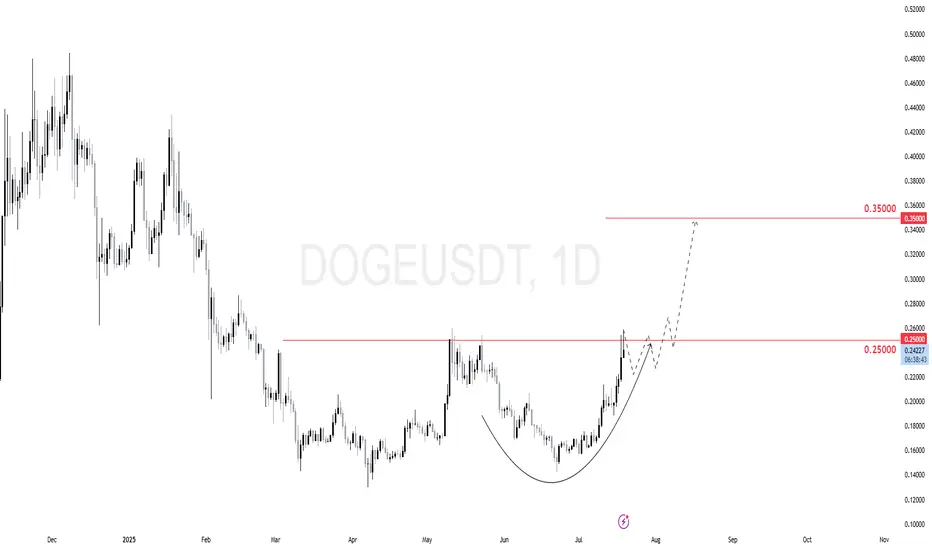
$DOGE (DOGECOIN) 1DDOGE just broke above the 0.25 key resistance.
The daily chart shows a clean cup-and-handle formation with a potential continuation setup.
Price might consolidate just above 0.25, creating a bullish base.
Then we expect a continuation move toward 0.35 as next target.
The Meme Coin Race Has Begun, DOGE fighting for top spot!📈 The Meme Coin Race Has Begun
🔥 The battle for the throne is heating up...
🐶 DOGE, the original meme coin, isn’t giving up its crown without a fight.
Fractals from the past seem to echo in today's chart – history doesn’t repeat, but it rhymes.
⚔️ With new challengers lining up in the meme arena, one question remains:
Can DOGE reach $2.45 and reclaim the top spot?
🚀 Volume is rising. Patterns are aligning.
The king is awake.
👑 The OG vs the New School. Who will win the meme war?
Comment your prediction 👇
#DOGE #MemeSeason #CryptoFractals #Altseason #DOGEUSDT #CryptoTrading #TradingView #FractalAnalysis #CryptoWar #MemeCoins

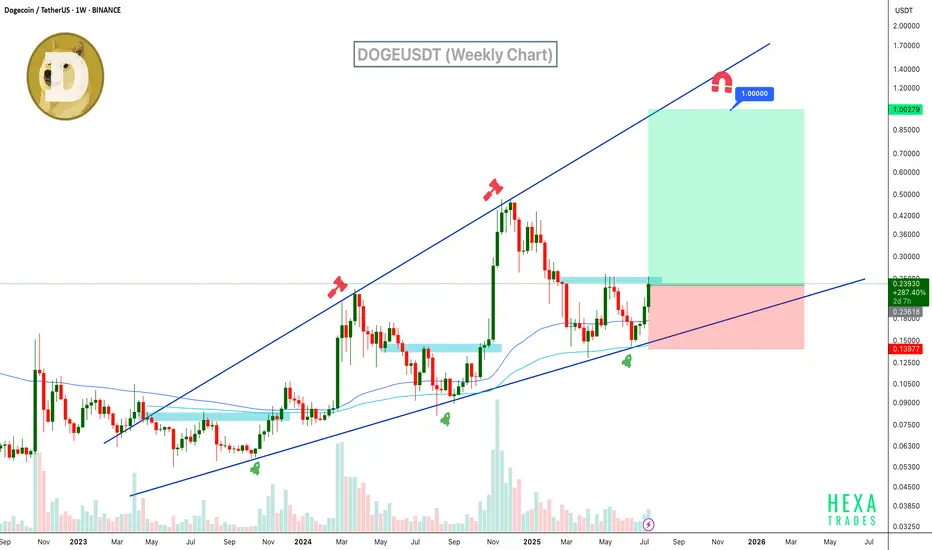
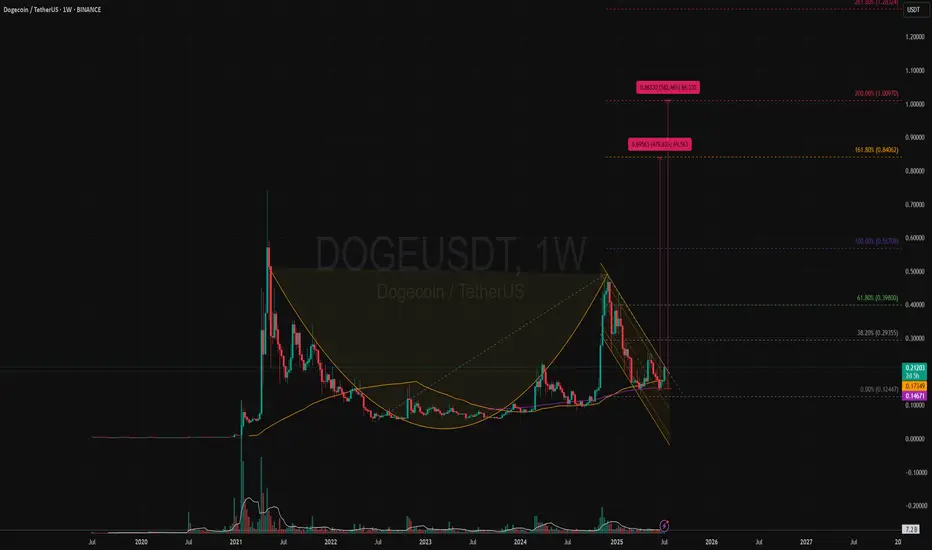
Will DOGE Hit $1? Ascending Broadening Wedge in PlayDogecoin is trading within a clear ascending broadening wedge on the weekly chart. The price has bounced strongly from wedge support and the 100 and 200 EMAs, now pushing upward with growing volume and bullish candles. If momentum sustains, DOGE could rally toward the $1 psychological target and broadening wedge resistance.
Resistance 1: $0.35
Resistance 2: $0.60
Resistance 3: $1.00
Stop Loss: $0.14
Cheers
Hexa
COINBASE:DOGEUSD BINANCE:DOGEUSDT
Dogecoin Wave Analysis – 25 July 2025
- Dogecoin reversed from resistance zone
- Likely to fall to support level 0.2000
Dogecoin cryptocurrency recently reversed down from the resistance zone between the key resistance level 0.2630 (former monthly low from December, acting as the resistance now), standing near the upper daily Bollinger Band.
This resistance zone wad further strengthened by the 38.2% Fibonacci correction of the previous sharp downward impulse from December.
Given the clear daily downtrend, Dogecoin cryptocurrency can be expected to fall to the next round support level 0.2000 (target price for the completion of the active correction ii).

DOGEUSDT | Bullish Cup & Handle Revisiting Target +500% (1 USD)?Price Action and Chart Pattern Analysis:
DOGE cup bottom happened around $0.05 with the rim around $0.48. That gives a depth of roughly $0.42. If the breakout occurs near the rim, the measured move target would be $0.90 zone.
This aligns with several analyst projections suggesting DOGE could reach $0.90 to $1.00 if the breakout confirms.
Another way to project this cup & handle is the fibonacci-based target. These levels suggest that if DOGE breaks above the handle and sustains momentum, $0.85–$1.00 is a realistic zone for profit-taking at 161.8% and 200% extension as 1-2-3 wave pattern.
Reliability of the Cup and Handle Pattern for DOGE
The cup and handle is a classic bullish continuation pattern, but when applied to Dogecoin, its reliability depends on several dynamic factors:
Strengths of the Pattern in DOGE’s Context
Historical Accuracy: DOGE has previously respected technical patterns like rounded bottoms or (THE CUP) and breakout channels (THE HANDLE), especially during alt coin rallies.
Current Setup: a well-formed cup and handle on DOGE’s weekly chart, with price rebounding from $0.14 and testing resistance at $0.2 zone which also the key resistance SMA50W and the downtrend channel (the handle)
WATCH OUT: still a possible throw-under pattern or a final bear trap liquidity below previous low!
Key Action: If breakout confirmed with volume > Follow BUY | if not, wait for retraced SMA20 or breakout support.
Always trade with affordable risk and respect your stop...
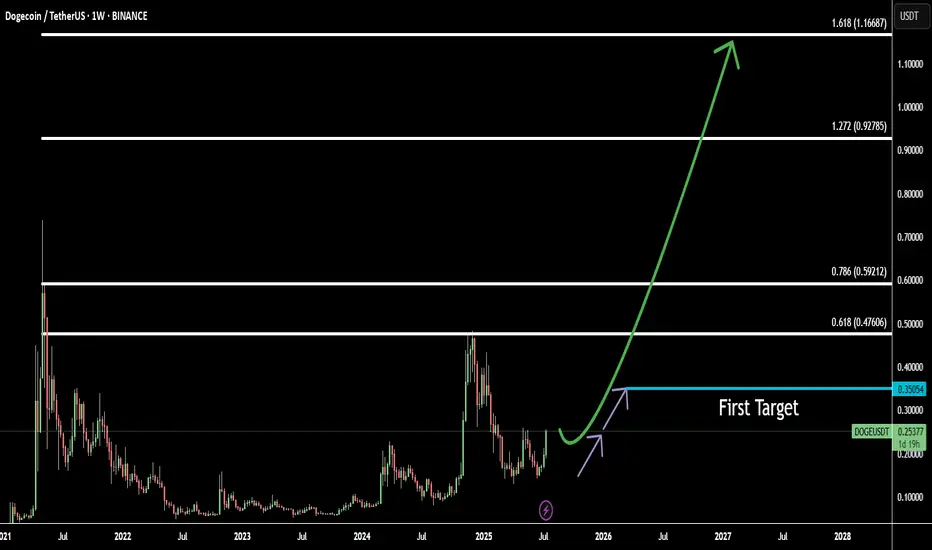
DOGE Weekly Double Bottom: Eyeing 5 Fibonacci TargetsDogecoin (DOGEUSD) is showing a bullish double bottom pattern on the weekly chart, suggesting a potential long-term reversal from previous downtrends. This classic accumulation pattern is forming near a key historical support level, adding confidence to the bullish case.
Using Fibonacci extensions from the neckline breakout, I’ve identified 5 major target zones:
Target 1: 0.35054 — conservative target confirming breakout
Target 2: 0.47606 — often hit during early momentum phases
Target 3: 0.59212 — key level for profit-taking and resistance
Target 4: 0.92785 — full measured move of the double bottom
Target 5: 1.16687 — aggressive bull target if momentum continues
The breakout is only confirmed if price holds above the neckline with strong volume. Risk management is crucial in case of a retest or false breakout.
DOGE Update: Reversal Playing Out — $1+ in Sight?DOGE is playing out almost exactly as forecast back on June 14th, where I was monitoring for price to sweep the SSL and tap into range low demand within this larger HTF range.
Price did exactly that — pushing into discount, tagging the marked demand zone, and bottoming out right where I expected the reversal. I DCA’d hard at $0.165 after the initial low printed — just as planned.
Now sitting around +50% on those buys, and my plan remains to ride this out toward the ATH at $0.74 and potentially $1+.
The HTF closes forming here — across 3D, 4D, 5D, 6D candles — are showing clear strength. For me, the low is likely in, and I’m expecting new higher highs and ATHs from here. Now it’s just about letting the market do its thing, trailing stops, and taking profits into strength as alerts and targets get hit.
Zooming way out — I’m also watching DOGE’s 10-year uptrend channel. Price has once again tagged the lower bound of that channel, and historically, this has led to moves back to the channel highs.
🧠 Layer on a fib projection from the previous ATH to the bear market low, and we get:
1.272 Fib → ~$1.54
1.618 Fib → ~$3.92
Both of which align perfectly with the upper bounds of that long-term trend channel — giving us a key HTF reversal zone to monitor in the future.
In summary:
- Reversal from demand ✅
- DCA filled ✅
- HLs printing ✅
- Targets = ATH and beyond
- Watching HTF fibs + channel highs for eventual cycle top formation
DOGE is doing what DOGE does — don’t overcomplicate it.
1D:
3D:
1W:
1M:
Portfolio Destruction In Bull Markets = Greed Without Strategy When the market is bullish, everyone thinks whatever they buy will make a profit.
But does a rising price really mean you’re winning? Or are you just chasing an illusion?
What kills most traders is greedy trading without a clear plan even when the market is green!
Hello✌
Spend 3 minutes ⏰ reading this educational material.
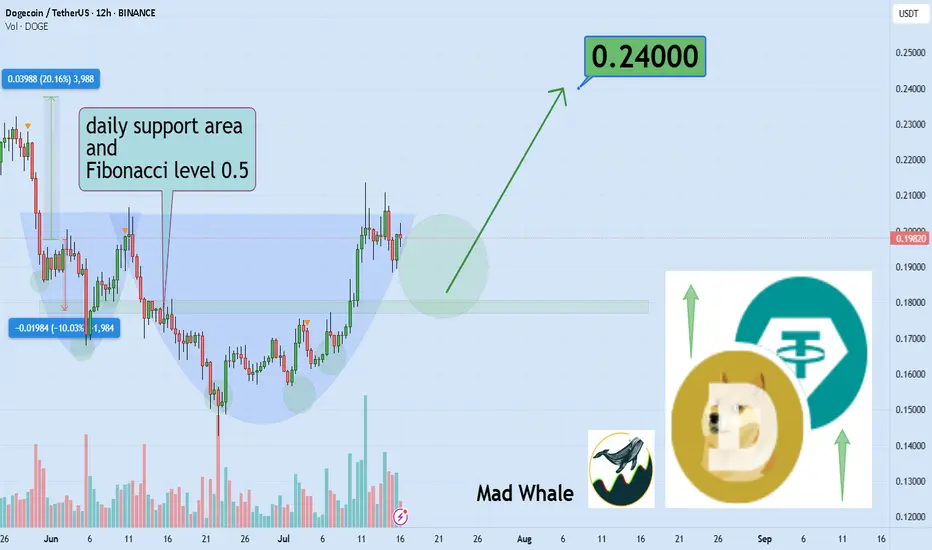
🎯 Analytical Insight on Dogecoin :
🚀 After breaking out of its daily downtrend channel, BINANCE:DOGEUSDT is now testing a strong support zone near the 0.5 Fibonacci level. This setup suggests the potential for a further 20% upside, with the main target around 0.24.
Now, let's dive into the educational section,
🧨 When the market is green fear should grow
In bearish markets people are cautious But in bull runs everyone fears missing out
This phase is exactly what pumpers love Why Because they know people are ready to chase every green candle
Are you actually profiting or just running after profits
If you do not have a strategy if your exit points are not clear if you do not know when to take profits
You are giving the game away to others
🕳️ Illusion of control traders’ silent enemy
When a few trades go well you think you have got the market figured out But actually the market has you
This sense of control mixed with greed leads to heavy risking skipping stop losses or riding fake pumps to the end
What is the solution Only strategy No influencer hype no social media noise no candle colors.
📊 Smart use of TradingView’s tools:
Many traders decide with emotions not data
But with a few simple TradingView tools you can base your decisions on data not feelings
One of the most practical indicators to spot overbought conditions or excessive greed is the RSI
When RSI goes above seventy it means the market is in a hype phase That is when many blindly jump in
A simple method Add RSI to your favorite crypto chart and check if a pump happened in the overbought zone
Another tool Volume Profile shows you the price levels with the highest trading volume
When price hits an area with very low volume behind it be cautious This could be a fake top
A golden tip Use TradingView Alerts
Instead of constantly staring at charts set alerts for when RSI passes seventy five or price reaches a suspicious zone Then get notified instantly
This way you let data guide you not momentary excitement
And this is exactly where you separate yourself from an unplanned greedy trader
💡 Summary and advice
Trading without strategy whether in bull or bear markets puts your capital at risk sooner or later
You can’t remove greed but you can control it
TradingView tools exist for exactly this reason to help you think before you act
Profit comes from planning not from chasing the next pump
✨ Need a little love!
We pour love into every post your support keeps us inspired! 💛 Don’t be shy, we’d love to hear from you on comments. Big thanks , Mad Whale 🐋
📜Please make sure to do your own research before investing, and review the disclaimer provided at the end of each post.
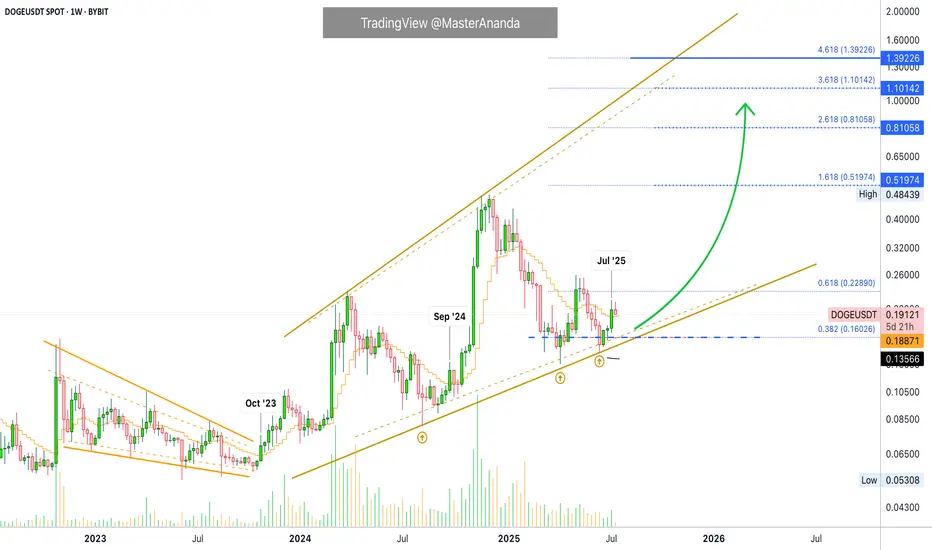
Dogecoin's Bullish Wave Over? Higher High Beyond $1.11111Nope, it is only getting started... Do you see that tiny speck of a black line on the chart? Way below the current candles around 0.135. That's MA200 weekly. Dogecoin is on the bullish zone 100% already confirmed. The bullish wave is only getting started.
DOGEUSDT is trading weekly above EMA13. Watch what happened in September 2024 when Dogecoin broke above this level. Or further back, October 2023. Both instances, there was a bullish impulse; both instances, a higher high.
Dogecoin moved and closed above EMA13 last week, July 2025. Guess what will happen next? A new bullish impulse and a strong higher high.
Patience is key, the market is set to continue growing long-term. No, the uptrend is not over, it is only getting started.
Thanks a lot for your continued support.
Namaste.
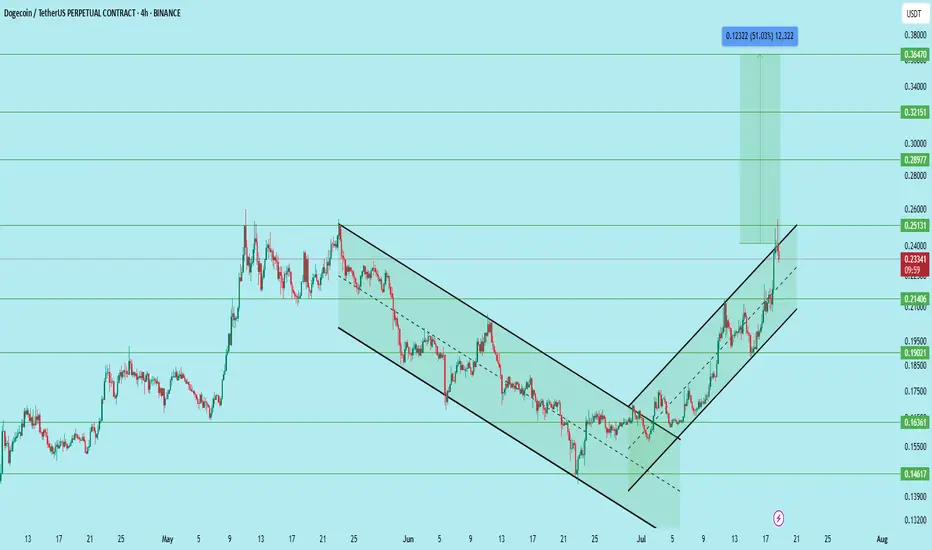
DOGE/USDT – Bullish Setup with Clear Channel BreakoutDogecoin has successfully broken out of a falling wedge and is now trending within a rising channel on the 4H timeframe. The price recently reclaimed the 0.214 support zone and is now showing continuation with strong volume and structure.
After the breakout and multiple retests, the pair offers a compelling long opportunity.
Setup Details:
Entry Zone: 0.208 to 0.214
Stop Loss: 0.186
Targets:
• 0.251 – First major resistance
• 0.289 – Mid-level breakout target
• 0.321 – Psychological round number
• 0.364 – Final target (approx. 51% move)
Technical Structure:
Breakout from falling wedge followed by bullish channel, Higher highs and higher lows clearly forming, Volume supports accumulation near breakout levels, Support holding above 0.214, confirming demand
Support Zones:
0.214 (reclaimed)
0.190 (intermediate)
0.163 (major demand zone)
Resistance Zones:
0.251
0.289
0.321
0.364
This setup offers a clean risk-reward ratio with confirmation on trend continuation. A rejection at 0.251 may present another opportunity to re-enter on a retest.
DYOR. Not financial advice.
DOGEUSDT: Time For Bulls To Rule! The Dogecoin is currently trading at a key buying level, making it a potential opportunity to buy. However, we need confirmation before making a purchase or entering a trade. This trade could take time to develop as we are currently in the accumulating phase. To be certain of the price direction, we need to enter the distribution phase. While a single swing trade could be a target, you can set your own risk management parameters.
Good luck and trade safely!
Team Setupsfx_

DOGEUSDT WEEKLY CHART | MY FAVORITEHELLO, DOGEUSDT
MEMECOIN my favoritoo
This is just my basic analysis. I see that DOGEUSDT Weekly looks very promising.
Why the Weekly? Because I’m aiming for the long term with DOGEUSDT — i'm Doge Holder..
Only patient people will reap the rewards of their efforts.
Remember, trading involves risk, and you are responsible for your own decisions — manage your finances wisely.

DO GE - Call the Ambulance!Okay DOGE thinks he is smart but he aint he will be taking hype and fall down and fall down in the place where no one can expect! Quasimodo in position!

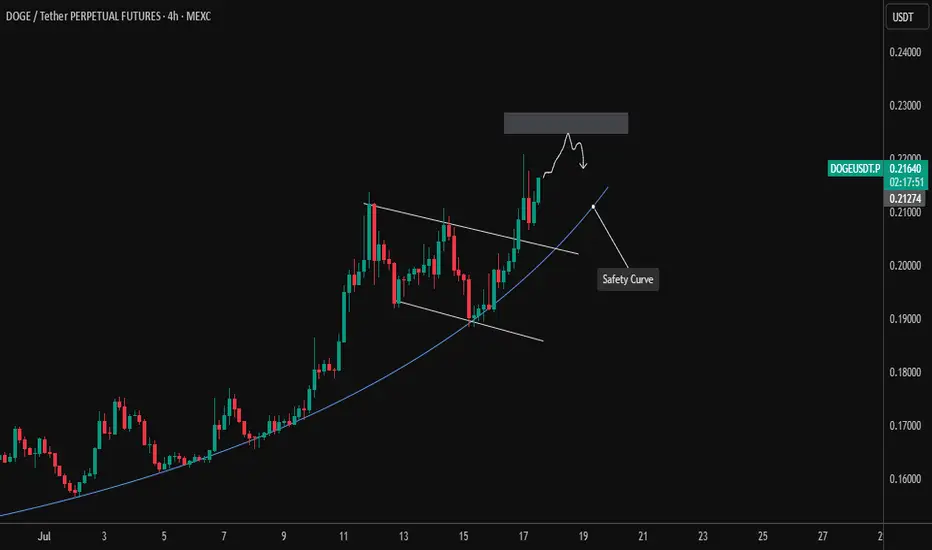
DOGE/USDT – 4H Chart Analysis (July 17, 2025)Dogecoin has been riding a strong uptrend, maintaining its momentum along a parabolic safety curve, which has been respected multiple times.
📈 Recently, DOGE broke out of a descending channel and is now approaching a resistance zone around $0.225–$0.230. This area previously acted as a supply zone, and price action suggests a short-term rejection could be forming.
🟦 Key Observations:
Parabolic trendline acting as a "safety curve" support.
Price approaching a supply zone with signs of slowing momentum.
Potential short-term double top or lower high forming.
📌 Scenarios to Watch:
Pullback from resistance → Retest of the safety curve (~$0.21) = potential long setup.
Break and hold above $0.230 = bullish continuation, targeting new local highs.
⚠️ Risk Management: Enter on confirmation; don't chase green candles near supply. A breakdown of the safety curve may lead to deeper correction.
#Dogecoin #DOGEUSDT #Crypto #TechnicalAnalysis #Altcoins #MEXC
DOGEUSDT UPDATE
Pattern: Falling Wedge Breakout
Current Price: \$0.24086
Target Price: \$0.4667
Target % Gain: 125.41%
Technical Analysis: DOGE has broken out of a falling wedge pattern on the 1D chart with strong bullish momentum and a +10.35% daily candle. The breakout is confirmed with increasing volume, suggesting continuation toward the target zone.
Time Frame: 1D
Risk Management Tip: Always use proper risk management.

The Right Way to Manage Stop Loss: Dynamic Logic for Smart ExitsContext
In fast-moving markets, static stop losses often sabotage good trades by exiting too soon or too late. This approach uses dynamic, logic-driven stop loss adjustments that adapt to market context instead of sticking to a single fixed distance.
⸻
Key Principles of This Stop Loss Logic
Contextual Initial Placement
The stop is never just a fixed percentage below entry. It adapts based on recent swing lows/highs, ATR volatility, and trend confirmation signals.
Dynamic Extension in Favorable Conditions
If price retraces but shows bullish reversal evidence such as deep oversold signals, positive divergence, or compression breakouts, the stop loss is extended instead of closing immediately. This prevents cutting winners during normal pullbacks.
Tightening When Momentum Fades
If momentum weakens (for example, ADX drops, failed bounce, or resistance rejection), the stop is tightened dynamically. This reduces drawdown if the trend fails.
Clear Exit Triggers
The system can exit on consolidation breakdowns below support, confirmed bearish reversal patterns, or time-based exits if no continuation happens.
⸻
Examples and Visuals
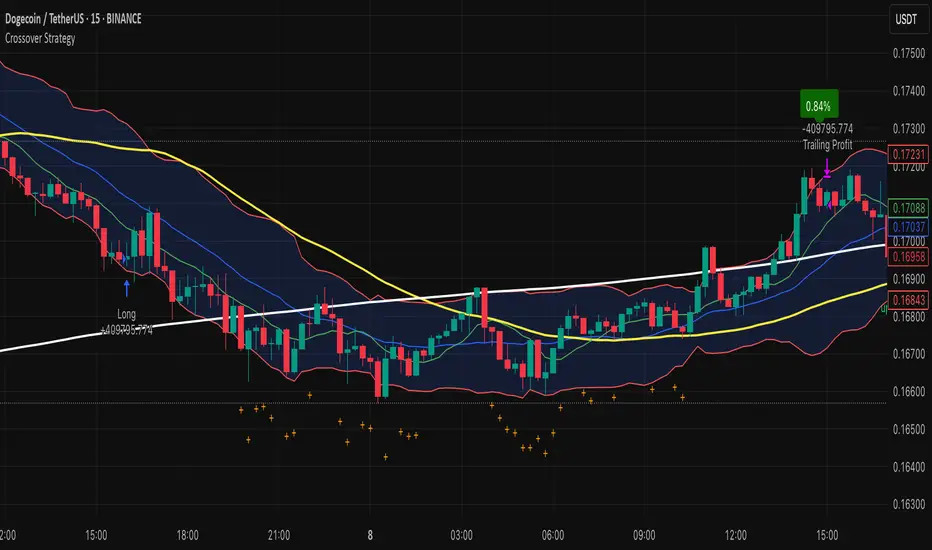
Below, I’ve included chart examples with screenshots from my Multi Crossover Strategy . These images illustrate how dynamic stop loss management behaves in real conditions—showing entries, extensions during retracements, and exits triggered by different scenarios. You can see how the logic responds to changing volatility and trend strength in real time.
The "+" signs mark bars where the position would have closed using the default settings of 2.5 ATR Multiplier stop loss. A bullish reversal signal extended the stop, allowing the trade to close profitably instead of at a loss.
This example shows an early exit triggered by a consolidation breakdown. The system closed the position before the maximum stop loss was reached, limiting the loss as bearish momentum increased.
Example for lower high close to reduce loss. Here, the position was closed after a failed bounce and the formation of a lower high, signaling a likely continuation of the downtrend and helping to reduce the loss before a deeper move.
⸻
Advantages Over Simple Stop Losses
Adaptation
Stops react to volatility and price structure, not arbitrary distances.
Risk Mitigation
Dynamic tightening locks in gains faster when momentum fades.
Confidence to Stay In
Dynamic extension reduces the chance of premature exits during healthy retracements.
⸻
How to Use This Approach
When designing your strategy, start by defining a volatility-adjusted stop using an ATR multiplier as the base distance from entry. You can then set a maximum allowable loss in percentage terms to cap risk exposure to a fixed threshold.
After establishing your initial stop, consider adding layered adjustments that respond to different levels of reversal risk. For example:
ATR Multiplier: the factor used to calculate the initial stop distance based on market volatility.
Maximum Loss (%): the maximum risk per trade, defined as a percentage below the entry price.
Tight Stop Loss (%): a closer stop level that activates when early signs of a potential reversal appear, such as weakening momentum or minor bearish movement.
Bearish Stop Loss (%): a further tightening of the stop distance when stronger bearish reversal signals occur, including failed bounce attempts, lower highs, or clear resistance rejections. This level reduces the tolerance for further losses but still allows the trade to remain open if price stabilizes.
Extended Stop Loss Percentage Add-On: an additional percentage beyond the maximum loss cap, temporarily applied if strong bullish recovery signals appear.
In addition to these percentage-based stop adjustments, you can define instant exit rules that immediately close the position as soon as specific structural conditions are met. Unlike percentage-based stops, instant exits do not wait for further price movement or confirmation. They are typically used to react to decisive events such as a confirmed breakdown below support, a lower high after a failed bounce, or a sharp rejection at a resistance level. This combination of tightened stops and instant exit triggers allows for a flexible but disciplined approach to managing trades.
Pro Tip:
Most traders lose because their stops don’t evolve with the trade. Build a logic tree:
If trend = strong ➡ extend stop
If reversal risk ➡ tighten stop
If clear reversal signs ➡ exit
⸻
Disclaimer: This content is for educational purposes only and does not constitute financial advice. Please do your own research before making trading decisions.
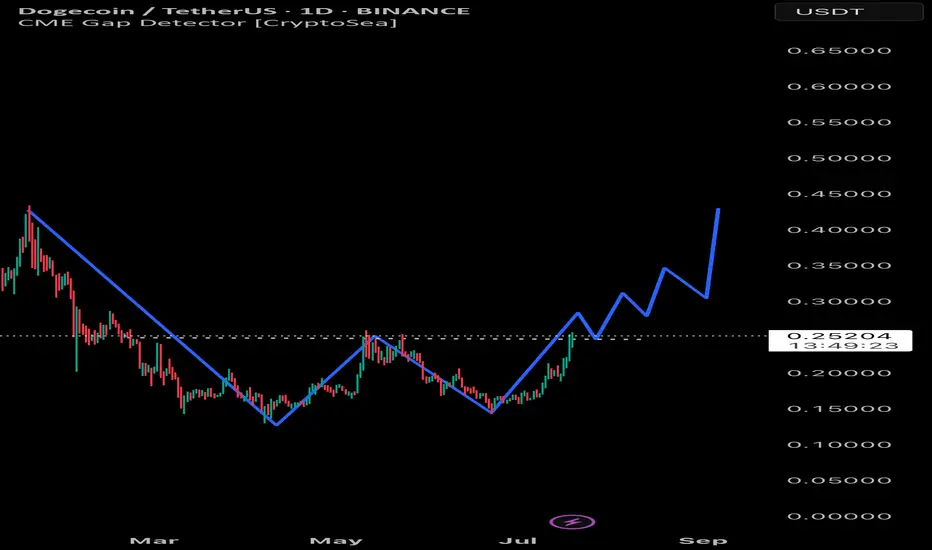
DOGE - Major W Reversal Pattern?Dogecoin (DOGE/USDT) is forming what appears to be a textbook W pattern on the daily timeframe — a bullish reversal signal that could indicate a strong upside move.
🔹 Key levels:
• Support: Around $0.12
• Resistance: Neckline at ~$0.26
• Breakout target: $0.40+
🔍 Pattern Insight:
This W pattern (double bottom) shows that sellers lost momentum, and bulls are stepping in. If we break and close above the neckline with strong volume, a rally toward $0.40 and above is on the table.
⚠️ Watch for:
• Break and retest of $0.26
• RSI confirmation
• Volume breakout
💬 Let me know in the comments — is DOGE getting ready for liftoff?
#Dogecoin #Crypto #TradingView #Altcoins #TechnicalAnalysis #DOGEUSDT #ChartPatterns
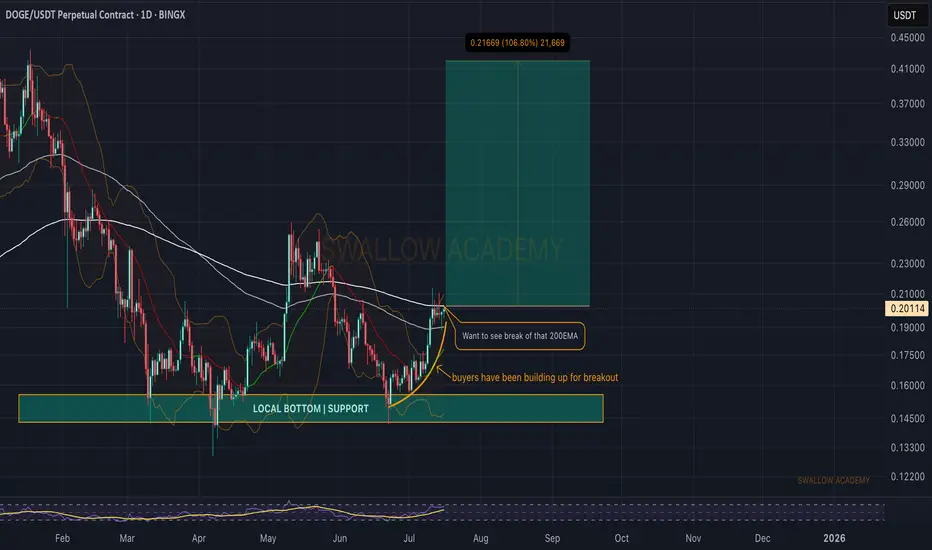
Dogecoin (DOGE): About To Breakout and Start Strong Bullish MoveDogecoin has been on our radars for quite some time, and we had a nice bounce since last time (from the local bottom).
Now we are approaching the breakout point (200 EMA) area, where upon seeing the break we should start a strong upward movement.
Swallow Academy