DOGEUST trade ideas

doge buy midterm"🌟 Welcome to Golden Candle! 🌟
We're a team of 📈 passionate traders 📉 who love sharing our 🔍 technical analysis insights 🔎 with the TradingView community. 🌎
Our goal is to provide 💡 valuable perspectives 💡 on market trends and patterns, but 🚫 please note that our analyses are not intended as buy or sell recommendations. 🚫
Instead, they reflect our own 💭 personal attitudes and thoughts. 💭
Follow along and 📚 learn 📚 from our analyses! 📊💡"

DOGE's Situation, A Comprehensive Analysis !!!The price on the 3D timeframe is within an ascending triangle, which can be promising. If the price breaks this pattern with bullish candles, it could easily rise by the distance of AB=CD .
Best regards CobraVanguard.💚

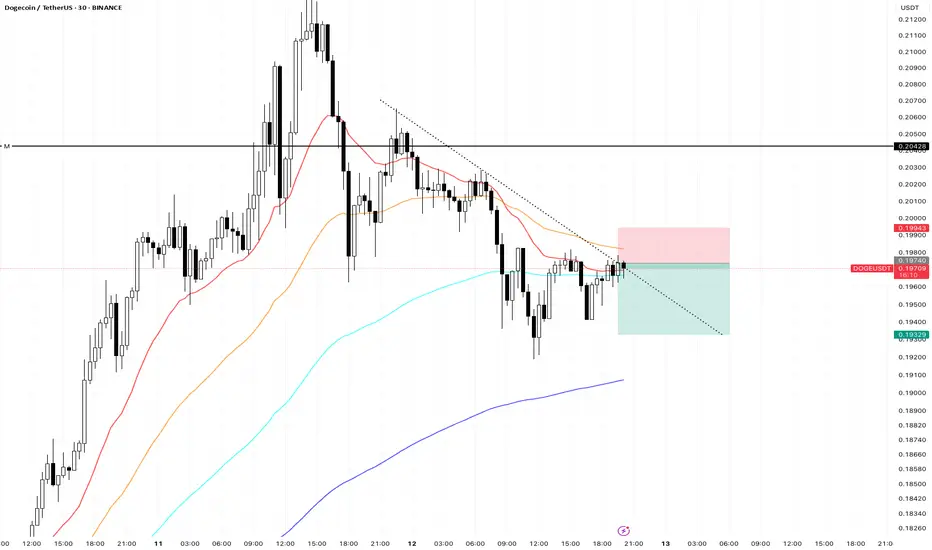
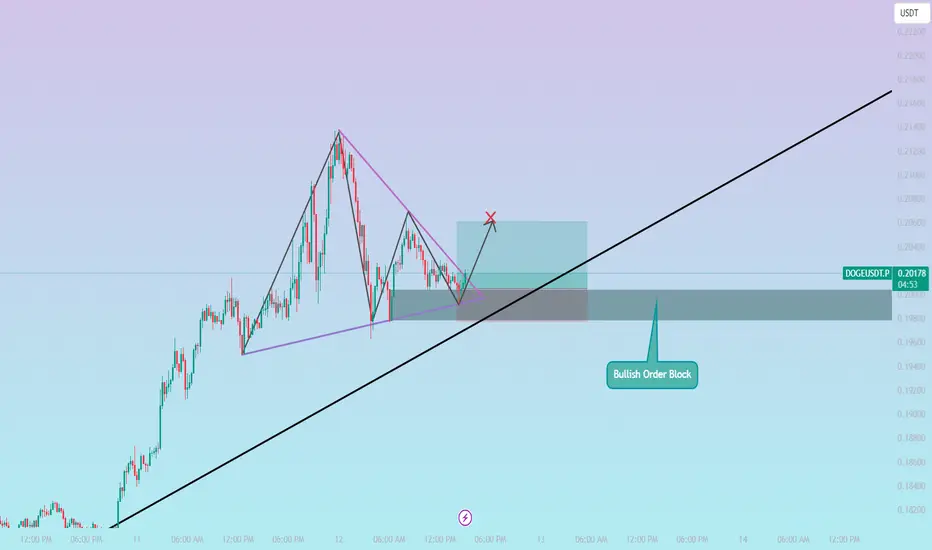
DOGEUSDT / 15M / LONG🚀 DOGEUSDT Long Opportunity | Bullish Order Block + Trendline Confluence
DOGEUSDT is showing signs of a potential bullish reversal from a Bullish Order Block on the 15-minute timeframe. Price has respected the ascending trendline while forming a corrective structure, and we can see clear liquidity grab wicks into the order block zone.
🧠 Smart Money Insight:
The price dipped into the Bullish OB where institutions likely accumulated long positions. With the trendline intact and structure holding, we expect price to push up, targeting liquidity above recent highs.
🔹 Entry: ~0.20050 (Within OB zone)
🔹 Stop Loss: 0.19772 (Below OB invalidation + liquidity sweep)
🔹 Take Profit: 0.20607 (Above recent swing high)
🔹 Risk:Reward Ratio: 1:2 ✅
📌 Confluences:
Bullish Order Block
Trendline support
Break of market structure to the upside
Clear corrective wave into OB (possible Wyckoff accumulation behavior)
🎯 If price maintains above the OB and breaks structure, this could lead to a bullish impulsive wave.
DOGE's Situation, A Comprehensive Analysis (1h) !!!The price on the 1-hour timeframe is within an ascending triangle, which can be promising. If the price breaks this pattern with bullish candles, it could easily rise by the distance of AB=CD .
Best regards CobraVanguard.💚

Dogecoin Prepares 2025 Bullish Wave · New All-Time HighThe last time that Dogecoin produced strong bullish action was November 2024, more than 217 days ago. Before this wave, there was a small period of growth in early 2024 and that's about it, the market was bearish for a long-time after the 2021 all-time high. There is good news though. Dogecoin is preparing for a new major bullish cycle and this cycle is already in place.
Since mid-March 2025 the action has been weak. No growth but no decline either. Between May and June, there were more than 8 weeks of bearish action but Dogecoin's price remains strong within a mid-term higher low. The last three weeks have been green with this week being full green trading at the top of the candle, the market is about to produce a major advance.
If you look back to October 2024, late, you will see small candles then several huge big candles, maximum growth. That's how Crypto tends to operate. One day the market is silent, the next day we are witnessing the strongest ever bullish wave. This is what Dogecoin is getting into right now.
If you look back to early 2021 it is the same. Late March and early April 2021 we have very small candles and then everything changes suddenly and the market produced astonishing growth. We are on the verge of such an event, the 2025 bull market phase and bull run. Get ready and prepare for a new all-time high.
Namaste.

Dogecoin Daily, A Closer View · Next Target, How To Trade & MoreYesterday Dogecoin moved above EMA89, a major long-term moving average. Definitely bullish confirmed. We are giving Dogecoin a closer look because the other chart was based on the long long-term, the weekly timeframe. With this one, we will know exactly what happens next.
Today, DOGEUSDT is moving above EMA233 and this one is super long-term. Immediate resistance is found at 0.21300 but this is likely to break right away, always allowing for a few days of fluctuation because the market never moves straight down nor straight up. It fluctuates creating waves.
The next target after this one is 0.26500 followed by 0.34900. These can be hit short-term. In the coming weeks and days. After this one, we will aim at the last high which happened December 2024, now already a long-time ago.
The altcoins market is bullish but this bullishness is very early, it is only getting started. The market will be bullish for such a prolonged period of time that you will get used to seeing bullish action and at one point will become comfortable seeing your profits grow. When this happens, stay alert and make sure to secure some wins on the way up.
Do not chase rising pairs, buy those trading near support. Buy and hold.
This is the best strategy for maximum profits. Also, if you catch a winner, let it ride long-term. This also produces bigger profits in the end vs selling and trying to catch the retrace to buy again. It is better to buy big when prices are low and hold long-term. Only secure some profits when you are really high up, after 2-3 months. And of course, when the time for the new all-time highs is close, that's the time to close all positions.
Thanks a lot for your continued support.
Namaste.

DOGE/USDT – Is Dogecoin About to Ignite Altseason Again?Hey Traders!
If you’re finding value in this analysis, smash that 👍 and hit Follow for high-accuracy trade setups that actually deliver!
Dogecoin just broke out of a multi-month descending wedge — and history tells us to pay close attention when this meme king wakes up. Let’s dive into why this setup could be the start of something massive.
📈 Chart Pattern
DOGE has been consolidating for months inside a falling wedge — a classic bullish reversal structure. It’s now finally broken out with strong volume confirmation, holding above the 50 EMA and showing signs of momentum building up.
🔍 Historical Clue
Remember what happened in the previous bull markets?
✅ 2021: DOGE exploded 2000%+ and triggered the craziest altseason ever.
✅ 2017: DOGE moved first, followed by hundreds of altcoins rallying massively.
Now, in 2025 — it looks eerily similar. Every time DOGE wakes up, it signals that retail and meme sentiment is heating up, a classic altseason ignition.
🎯 Trade Setup
Entry: $0.198 (Already triggered)
Targets:
TP1: $0.28
TP2: $0.42
TP3: $0.64
Stoploss: $0.162
Risk-Reward: Massive upside potential, with clearly defined invalidation.
💡 Final Thoughts
Altcoins are starting to follow. ETH has broken out. XRP is running. BTC dominance has rejected trendline resistance. Everything is aligning. If history repeats, this breakout in DOGE could mark the official start of Altseason 2025.
👉 Don’t sleep on DOGE. This might just be the trigger we’ve been waiting for.
📌 Follow for more setups & insights. Stay tuned!

More DOGE - More WOWThe most probable trade of the morning times from Masta Crypta! with small sl like a sling shot!

DOGE | Preparing for Breakout Dogecoin appears to be setting up for a potential breakout from a long consolidation phase.
Key Technical Signals:
- Price has been consolidating near the range low around $0.14260 for months
- Recent price action shows higher lows formation
- RSI is showing signs of life after extended oversold conditions
Potential Long Setup:
- Entry: Current levels around $0.18025 or on any dip to support
- Target: Range high at $0.45000 (150%+ potential gain)
- Stop Loss: Below $0.14260 support level
Risk Factors:
- Crypto markets remain volatile
- Bitcoin correlation could impact movement
The technical setup suggests accumulation at these levels, with the potential for a significant move if the diagonal resistance is broken. However, failure to hold current support could lead to further downside.

DOGE/USDT – Breakout Retest Long SetupDOGE has broken out of local consolidation with momentum and is now retesting the breakout zone, offering a clean long entry with defined invalidation.
Setup Thesis:
After a strong impulse move, price pulled back with low aggression, signaling profit-taking rather than reversal. The current candle structure suggests demand is stepping in at prior resistance-turned-support. This is a textbook breakout-retest continuation setup.
Trade Plan:
Entry: ~$0.1810
Stop Loss: Below ~$0.1764 (beneath breakout zone and structure)
Target: ~$0.1940
R/R: Favorable risk profile with strong reward potential
Confirmation Factors:
Impulsive breakout
Controlled pullback with no aggressive selling
Retest occurring at structural pivot
Still aligned with broader uptrend context
Execution Note:
This setup works best with strong follow-through in the next couple of candles. If price stalls or closes below the stop zone, it's invalidated.

DOGEUSDT - near support? Holds or not??#DOGEUSDT... market just reached near his supporting area even ultimate area. That is around 0.10 and current market price is around 0.15
If market holds current supporting area then we can expect a bounce from here.
Below 0.10 we will never see again bounce ... Note that.
Good luck
Trade wisely

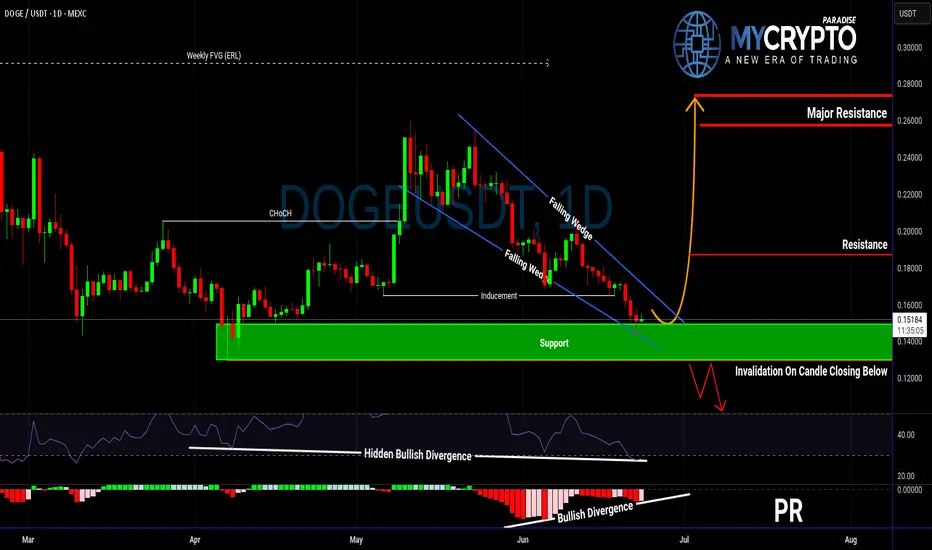
Is DOGE About to Explode or Collapse?Yello Paradisers! Are you ready for what could be DOGE’s most explosive move in weeks? DOGEUSDT is currently developing a very interesting bullish setup that deserves attention.
💎The pair has formed a falling wedge — a pattern that often precedes a breakout to the upside. This comes right after a confirmed bullish Change of Character (CHoCH), indicating that buyers are quietly stepping back in.
💎Even more important, we’ve seen a classic inducement grab, meaning early liquidity has been taken out, clearing the way for a potential real move. On top of that, there’s hidden bullish divergence on the RSI and clear bullish divergence on the MACD. This combination of signals significantly increases the probability of a bullish reversal from the current support zone.
💎If DOGE prints a convincing bullish candlestick pattern at these levels, it could offer a high-probability long opportunity with a strong risk-to-reward ratio. But be careful — if the price breaksdown and closes candle below this key support, the bullish scenario becomes invalid, and it’s better to wait for a more favorable structure to develop.
Strive for consistency, not quick profits. Treat the market as a businessman, not as a gambler. This is the only way you will make it far in your crypto trading journey. Be a PRO.
MyCryptoParadise
iFeel the success🌴
Dogecoin Will Shock Investors With Its Next Move!Today I’m doing an in-depth analysis of Dogecoin and its market cycle in comparison to the early Bitcoin cycles. As you can see, the same human psychology and emotions are playing out in the Dogecoin market that we previously saw with Bitcoin. With mass adoption coming to the cryptocurrency markets, it’s very possible we’ll see a parabolic run on Dogecoin similar to what we saw with Bitcoin in 2016 and 2017. This could lead us to a new all-time high.
Because markets are fractal in nature, we see similar patterns appearing over and over again. If you can learn to understand and identify these cycles and patterns, you can position yourself for maximum profit. I see Dogecoin running very bullish through the rest of 2025, and it could also continue into 2026 as mass adoption drives increasing demand for cryptocurrencies. In fact, we could see the entire crypto market run all the way into 2029, as the stock market is also primed for a large parabolic move in its own cycle.
Stocks and crypto are heavily correlated since both are tied to the global economy. Contrary to popular belief, the world economy may actually be set up for a massive run in value—almost like a “Roaring 20s 2.0.” This means buying Dogecoin today could be like buying Bitcoin in early 2016—the opportunity for profit is enormous.
As always, stay profitable.
- Dalin Anderson


#DOGE/USDT Long Swing Setup #DOGE
The price is moving within a descending channel on the 1-hour frame, adhering well to it, and is on its way to breaking it strongly upwards and retesting it.
We have a bounce from the lower boundary of the descending channel, this support at 0.1660.
We have a downtrend on the RSI indicator that is about to break and retest, supporting the upside.
There is a key support area in green at 0.16200, which represents a strong basis for the upside.
Don't forget one simple thing: ease and capital.
When you reach the first target, save some money and then change your stop-loss order to an entry order.
For inquiries, please leave a comment.
We have a trend of stability above the Moving Average 100.
Entry price: 0.17120
First target: 0.17420
Second target: 0.17788
Third target: 0.18250
Don't forget one simple thing: ease and capital.
When you reach the first target, save some money and then change your stop-loss order to an entry order.
For inquiries, please leave a comment.
Thank you.

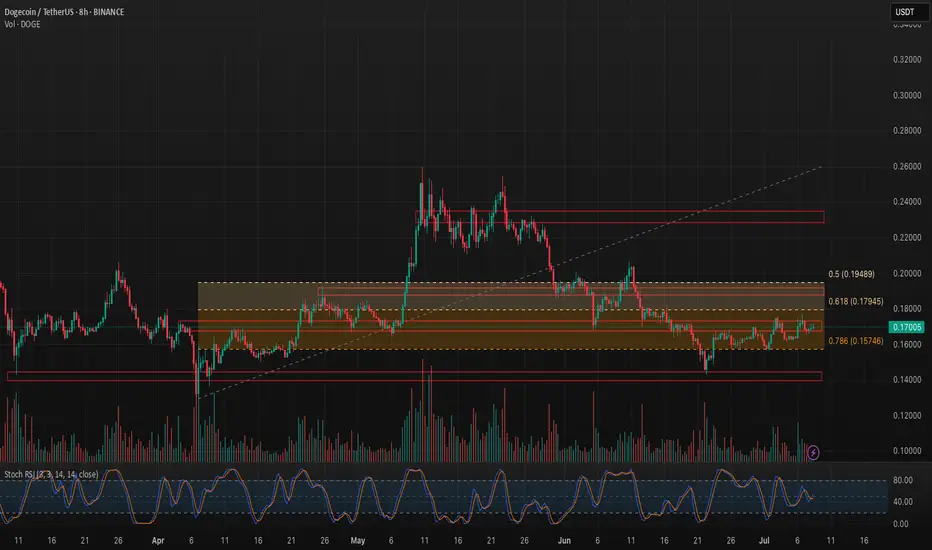
DOGE is stuck in the golden pocket... but for how long?📍Chart Breakdown:
Dogecoin is consolidating within a key Fibonacci retracement zone, ranging between $0.158 and $0.178 — what traders often call the “golden pocket.” Price is coiling just above critical support.
🟡 Fibonacci Zone (Golden Pocket):
The $0.158–$0.178 area has acted as both resistance (early May) and support (mid-June onward).
Holding this range = potential bullish continuation.
Breaking below = likely retest of $0.14 or lower.
📉 Recent Context:
Sharp drop from the $0.22–$0.23 area in early June.
Since then, DOGE has been trying to base out in this fib zone.
Trendline support from April still loosely intact.
📊 Indicators:
Stoch RSI: Mid-range (53), turning up — could indicate a potential bounce or continuation higher.
Volume: Still muted — watch for spikes on breakout attempts.
🧠 Trade Scenarios:
Bullish: Break and close above $0.178 could retarget $0.20 and eventually $0.23.
Bearish: Breakdown of $0.158 with volume = high risk of drop to $0.14
DOGE Long Swing Setup – Musk-Fueled Hype & Political BuzzElon Musk’s launch of the “America Party” is reigniting interest in his potential impact on crypto—especially Dogecoin. With his history of moving DOGE’s price, this political pivot could stir volatility and renewed upside. We’re watching for a dip into the $0.15–$0.16 zone for a possible long entry.
📌 Trade Setup:
• Entry Zone: $0.15 – $0.16
• Take Profit Targets:
o 🥇 $0.19 - $0.20
o 🥈 $0.23 – $0.24
• Stop Loss: Daily close below $0.13

DOGE Presses Into Long-Term Trendline — Breakout or Breakdown?DOGE is approaching a multi-month descending trendline with rising volume and an overbought stochastic RSI. Price is coiling in a tight triangle just below both the 50 and 200 EMA — a major move is on deck.
🟢 Scenario 1 – Bullish:
Break above $0.18 and reclaim of the 200 EMA ($0.20) could launch DOGE toward $0.25+. A confirmed flip of the trendline would mark a major sentiment shift.
🔴 Scenario 2 – Bearish:
A rejection here and break below $0.16 could lead to a steep drop toward $0.12 or lower. The red path shows a return to the broader downtrend if bulls fail to step in.
⚠️ Stoch RSI is at extreme levels — suggesting the next move may come soon.

All market will face to fall!All markets are expected to decline, so the focus should be on short positions.

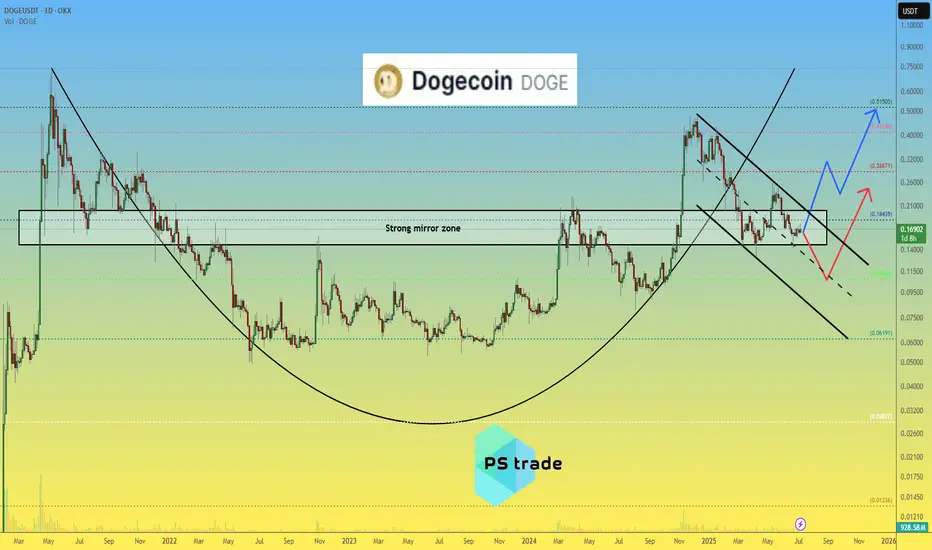
Dogecoin DOGE price analysisCRYPTOCAP:DOGE price is now in the middle of a strong mirror zone of $0.15-0.20
📈 It looks like the position is now accumulating, forming a "double bottom" and then, only a way for growth, to the highs in the region of $0.45-0.50
🐻 On the other hand, the scenario of another "leg" down fits perfectly into the TA canons. That is, it is very likely that if the price of OKX:DOGEUSDT drops below $0.15, then it is already fall to $0.10)
P.S.:
#Doge is an interesting asset, it is worth watching with one eye, and with the other eye, watch how the "battle" between Trump and Musk (who is the main influencer and "pumper" of #Dogecoin) will end.
💡 And then put the two pieces of information together and make a trading decision - "easy money" !)
_____________________
Did you like our analysis? Leave a comment, like, and follow to get more
DOGEUSDT Buy Long SetupWait for entry, if the tp hits first, then ignore the trade, I will share new entry.
