#DOGS/USDT#DOGS
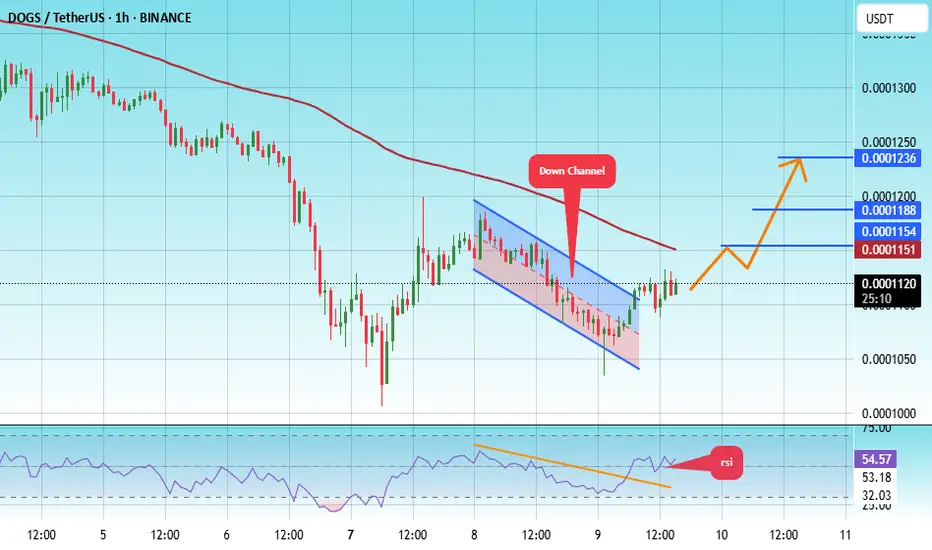
The price is moving within a descending channel on the 1-hour frame, adhering well to it, and is heading for a strong breakout and retest.
We are seeing a bounce from the lower boundary of the descending channel, which is support at 0.0001050.
We have a downtrend on the RSI indicator that is about to be broken and retested, supporting the upward trend.
We are looking for stability above the 100 moving average.
Entry price: 0.0001120
First target: 0.0001154
Second target: 0.000188
Third target: 0.0001236
DOGSUSDT trade ideas

DOGS/USDT (2H) Technical Snapshot🔻 Descending Channel: Price remains in a short-term downtrend but is testing strong support near the channel’s lower boundary.
🏹 Long Setup:
Entry: CURRENT MARKET MARKET
Stop Loss (SL): Below 0.066 (recent swing low)
Take Profit (TP):
TP1: 0.0001657
TP2: 0.0001989
📈 RSI Breakout: RSI is emerging from oversold territory, and trendline suggesting potential bullish momentum.
🔑 Confirmation: A 2H close above 0.070 confirms a breakout from the descending channel and strengthens the bullish case.

DOGSUSDT (1H) - Technical Analysis & Trade Setup📌 Market Overview:
The price experienced a strong bullish rally, followed by a sharp decline.
Currently trading near 0.0001587, forming a small consolidation after a strong sell-off.
Potential support zone around 0.0001500 - 0.0001550, which may act as a demand area.
The price is trying to stabilize after a correction from the peak.
📈 Trade Plan: Long Position (BUY Setup)
🎯 Entry: At Current Market Price (CMP) ~0.0001587
🎯 Take Profit Targets:
First Target (Resistance Level): 0.0001750
Second Target: 0.0001900 (Next key resistance)
Final Target (Strong Resistance): 0.0002000+
🔻 Stop-Loss:
Below 0.0001500, as a drop below this level could trigger further downside.

#DOGS/USDT#DOGS
The price is moving in a descending channel on the 1-hour frame and is adhering to it well and is heading to break it strongly upwards and retest it
We have a bounce from the lower limit of the descending channel, this support is at a price of 0.0001400
We have a downtrend on the RSI indicator that is about to break and retest, which supports the rise
We have a trend to stabilize above the moving average 100
Entry price 0.0001547
First target 0.0001640
Second target 0.0001790
Third target 0.0001920

#DOGS/USDT#DOGS
The price is moving within a descending channel on the 1-hour frame, adhering well to it, and is heading for a strong breakout and retest.
We are seeing a bounce from the lower boundary of the descending channel, which is support at 0.0001355
We have a downtrend on the RSI indicator that is about to be broken and retested, supporting the upward trend.
We are looking for stability above the 100 moving average.
Entry price: 0.0001410
First target: 0.0001463
Second target: 0.0001516
Third target: 0.0001585


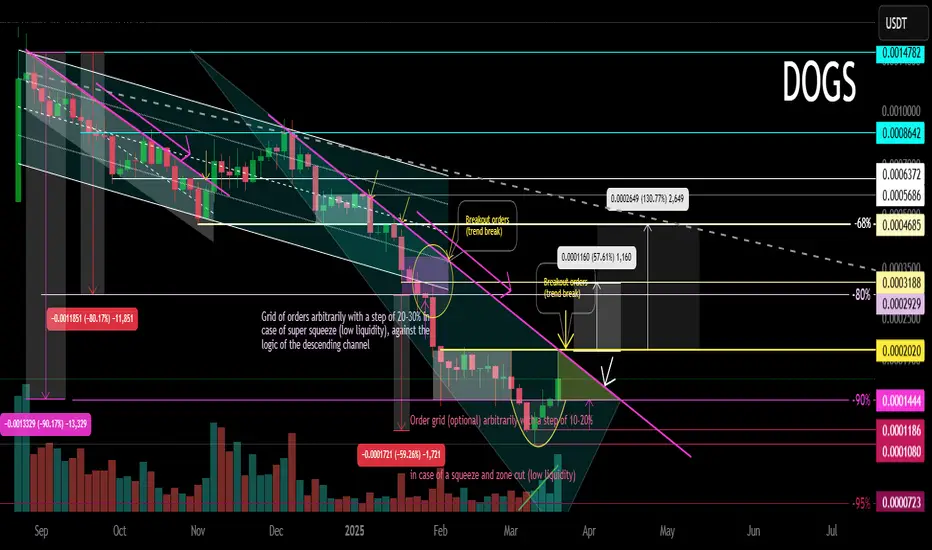
DOGS Main Trend. Tactics of Working on Risky Crypto 03 2025Logarithm. Time frame 3 days. Tactics of working on super-risky cryptocurrencies of low liquidity, which are always sold (without loading the glass), by the creators of “nothing”. In order to increase sales, of course, when they rationally reverse the trend and make pumps at a large % and marketing positive news "have time to buy". On such assets with such liquidity, “killed faith” (at the moment), and control of the emission in “one hand” it is not difficult. Something like in BabyDOGE.
On such assets you should always remember:
1️⃣ allocate a certain amount for work in general on such assets from the deposit as a whole.
2️⃣ distribute money (potential reversal and decline zones) from this allocated amount to each similar asset in advance.
3️⃣ diversify similar assets themselves (5-10 cryptocurrencies), understanding that sooner or later they will scam. The scam of one of them should not be reflected significantly on the balance of the pump/dump group of low liquidity. It is impossible to guess everything that does not depend on you, and it is not necessary. Your miscalculations (what does not depend on you) are smoothed out by your initial trading plan and risk control, that is, money management (money management).
4️⃣ Set adequate goals. Part of the position locally trade 40-80% (not necessary, but this sometimes reduces the risk).
5️⃣ Work with trigger orders and lower them if they did not work and the price falls.
6️⃣ Remember that in consolidation and cut zones in assets of such liquidity, stops are always knocked out, so the size of the stop does not really matter. It will be knocked out, especially before the reversal.
7️⃣ Before the reversal of the secondary trend, as a rule, they first do a “hamster pump” by a conditionally significant %, when everyone is "tired of waiting". They absorb all sales. Then the main pumping without passengers by a very large % takes place to form a distribution zone. As a rule, it will be lower than the pump highs, that is, in the zone when they are not afraid to buy, but believe that after a large pump, the highs will be overcome significantly.
8️⃣ Remember that assets of such liquidity decrease after listings or highs by:
a) active hype, bull market -50-70%
b) secondary trend without extraordinary events -90-93%
c) cycle change -96-98% or scam, if it is a 1-2 cycle project (there is no point in supporting the legend, how it is easier to make a candy wrapper from scratch without believing holders with coins).
9️⃣In the capitulation zone, there can be several of them depending on the trend of the market as a whole and rationality, the asset is of no interest to anyone. Everyone gets the impression that everything is a scam. That is, on the contrary, you need to collect the asset, observing money management, that is, your initial distribution of money and the risk that you agreed with in advance. As a rule, in such zones people "give up" and abandon their earlier vision.
🔟 After the entire position is set (pre-planned, according to your money management), stop and do not get stuck in the market and news noise. Wait for your first goals.
Remember, people always buy expensive, and refuse to buy cheap ("it's a scam", they try to "catch the bottom"), when "the Internet is not buzzing". This all happens because there is no vision, and as a consequence, no tactics of work and risk control . Many want to guess the “bottom”, or “maximums”, and refuse to sell when they are reached. The first and second are not conditionally available, on assets of such liquidity and emission control. But, there are probabilities that you can operate and earn on this, without getting stuck in the market noise. And also in the opinions of the majority (inclination to the dominant opinion and rejection of your plan and risk control), from which you must fence yourself off.
Most people, immersed in market noise and the opinions of others , choose for themselves the price movement, which is beneficial to them at the moment , and to which they are inclined, but do not provide themselves with the tactics of work. This is a key mistake, and the main manipulation that the conditional manipulator achieves, who, by the way, is sometimes not on the asset, to form an opinion and, as a consequence, the actions of the majority.
Because, in essence, most people do not have the tactics of work. Where the news FUD (inclination to the dominant opinion), “market noise” (cutting zones and collecting liquidity), the opinion of the majority, is directed, that is what they are inclined to.
When the price goes in the other direction, it is disappointment.
If these are futures — liquidation of the position. Zeroing out due to greed.
If this is spot — "proud random holders" , without the ability to average the position (no money), to reduce the average price of the position set as a whole, and as a result increase the % of profit in the future.
A trading plan and risk control are the basis, not guessing the price movement. If you do not have the first “two whales” of trading in your arsenal, then you have nothing. It doesn't matter how much you guess the potential movement, as the outcome of such practice is always the same, and it is not comforting.
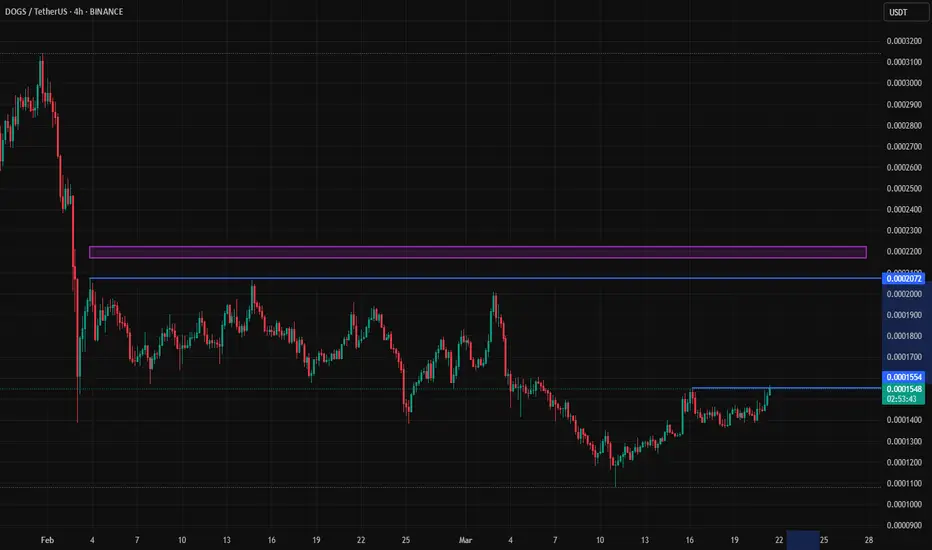
DOGSUSDT – Resistance Areas Marked by Blue Boxes! DOGSUSDT – Resistance Areas Marked by Blue Boxes! 🚀
“We’re at a key level—will the resistance hold or will buyers break through?”
🔥 Key Insights:
✅ Blue Boxes = Strong Resistance Zones – Expect reactions here.
✅ Rejection = Possible Short Opportunity – But only with confirmation.
✅ Breakout = Retest for Longs – We follow strength, not guesses.
💡 The Smart Plan:
Check Lower Time Frames (LTF) – 15M & 1H will show the breakout/rejection.
Use CDV & Volume Profile – We trade with smart money, not against it.
Trade the Reaction, Not the Prediction – If resistance holds, short. If it breaks, wait for a retest.
“Smart traders wait for confirmation—the blue boxes will show us the way!” 📉🔥🚀
A tiny part of my runners:
🎯 ZENUSDT.P: Patience & Profitability | %230 Reaction from the Sniper Entry
🐶 DOGEUSDT.P: Next Move
🎨 RENDERUSDT.P: Opportunity of the Month
💎 ETHUSDT.P: Where to Retrace
🟢 BNBUSDT.P: Potential Surge
📊 BTC Dominance: Reaction Zone
🌊 WAVESUSDT.P: Demand Zone Potential
🟣 UNIUSDT.P: Long-Term Trade
🔵 XRPUSDT.P: Entry Zones
🔗 LINKUSDT.P: Follow The River
📈 BTCUSDT.P: Two Key Demand Zones
🟩 POLUSDT: Bullish Momentum
🌟 PENDLEUSDT.P: Where Opportunity Meets Precision
🔥 BTCUSDT.P: Liquidation of Highly Leveraged Longs
🌊 SOLUSDT.P: SOL's Dip - Your Opportunity
🐸 1000PEPEUSDT.P: Prime Bounce Zone Unlocked
🚀 ETHUSDT.P: Set to Explode - Don't Miss This Game Changer
🤖 IQUSDT: Smart Plan
⚡️ PONDUSDT: A Trade Not Taken Is Better Than a Losing One
💼 STMXUSDT: 2 Buying Areas
🐢 TURBOUSDT: Buy Zones and Buyer Presence
🌍 ICPUSDT.P: Massive Upside Potential | Check the Trade Update For Seeing Results
🟠 IDEXUSDT: Spot Buy Area | %26 Profit if You Trade with MSB
📌 USUALUSDT: Buyers Are Active + %70 Profit in Total
🌟 FORTHUSDT: Sniper Entry +%26 Reaction
🐳 QKCUSDT: Sniper Entry +%57 Reaction
📊 BTC.D: Retest of Key Area Highly Likely
I stopped adding to the list because it's kinda tiring to add 5-10 charts in every move but you can check my profile and see that it goes on..

DOGS Capable of 30% potential growth🚀 DOGS: Time to gain?🥊
🎁 The DOGS coin has been at the bottom for a long time, having accumulated a decent amount of short liquidity. Apparently, it is ready for growth by 30%. This is more intuition than a clear trade idea, but if you want, you can enter an amount that you don’t mind losing.
🔮Do you think we’ll fly? 🚀
#DOGS #Crypto #Altcoins #Trading
#DOGS/USDT#DOGS
The price is moving in a descending channel on the 1-hour frame and is adhering to it well and is heading to break it strongly upwards and retest it
We have a bounce from the lower limit of the descending channel, this support is at a price of 0.0001280
We have a downtrend on the RSI indicator that is about to break and retest, which supports the rise
We have a trend to stabilize above the moving average 100
Entry price 0.0001280
First target 0.0001350
Second target 0.0001407
Third target 0.0001476

DOGSUSDT BUY SETUPAs the infamous altseason approaches, everything seems to align perfectly. We are all going to see the 50x run from major alt coins and here is my analysis for your next big trade. The market now rallies to take out all the internal sell side liquidity while not touching the protected low or external sell side liquidity, once that happens, the bulls will regain their power and the altseason starts. I expect BTC to run atleast 150-180k before the bull run is officially over, so tie your laces and fix your attire ladies & gentlemen, cause the wildfire is about to start, one that is led by institutions, one that will be written in the history books and one that changes the globalisation of crypto worldwide. If you don't go all in now, I doubt you won't be able to make a generational wealth out of this market after this alt season.

$DOGSUSDT LONG SETUPBacking The Fundamental And Having This Bullish Setup On The Technical. I Amd Bullish On $DOGS.
NFA

dogsusdtdogsusdt may b just in the start of accumulation pattern . let it give a try of long if comes in our zone .
never trade without sl

#DOGS/USDT#DOGS
The price is moving in a descending channel on the 1-hour frame and is adhering to it well and is heading to break it strongly upwards and retest it
We have a bounce from the lower limit of the descending channel, this support is at a price of 0.0001690
We have a downtrend on the RSI indicator that is about to break and retest, which supports the rise
We have a trend to stabilize above the moving average 100
Entry price 0.0001710
First target 0.0001775
Second target 0.0001850
Third target 0.0001932

Waining Bearish Momentum on DOGS (Bullish Reversal Incoming)I will use a classic signal to explain this one, because I can.
DOGS produced a double-bottom. Really high volume on the 3rd of February, much lower volume on the 25th. That's it. That's the classic signal and the entire analysis in summary.
Ok. You want to be entertained, correct?
Let's go further.
Look at the size of the candles, we are using the linear chart. It is necessary to have this setting to be able to spot this signal.
On the left side, the candles are really big. This big candles indicates momentum. To the right side, the candles are very small. This indicates a loss of momentum.
We have a down move with waining momentum. The loss of momentum means that the move is reaching its end. After a down move comes a bullish move, it is the only possible option because the market moves in only two ways, bearish and bullish, down and up. Wait, there is a third option, sideways...
So DOGS went down then sideways, down then sideways with waining bearish momentum.
DOGS will stop going down and soon will start to go up.
This is literally the message that is coming from this chart.
The chart is also saying, buy and hold.
Thanks a lot for your continued support.
Namaste.

Forget DOGE, SOLANA has DOGS with 400% forecastOn the above 13hr chart price action has dropped 80% in the last 50 days. Now is a opportunity to scoop up some magic beans from desperate sellers. Buy why?
1) Price action and RSI resistance breakouts.
2) RSI trend reversal.
3) Regular bullish divergence.
Is it possible price continues down? Sure.
Is it probable? No.
Ww

#DOGS/USDT#DOGS
The price is moving in a descending channel on the 1-hour frame and is adhering to it well and is heading to break it upwards strongly and retest it
We have a bounce from the lower limit of the descending channel, this support is at a price of 0.0001587
We have a downtrend on the RSI indicator that is about to break and retest, which supports the rise
We have a trend to stabilize above the moving average 100
Entry price 0.0001717
First target 0.0001760
Second target 0.0001842
Third target 0.0001927

DOGSUSDTWe can attempt to buy DOGSUSDT from specified level as it make HL , also 0.618 FIB level intact indicate that it moves upward.
SL , TP mention in chart.


ascendingThe end of the downward trend and the beginning of the upward movement. Valid support for exiting the range box. High goals

DOGSUSD NEXT MOVE
Sell after bearish candle stick pattern, buy after bullish candle stick pattern....
Best bullish pattern , engulfing candle or green hammer
Best bearish pattern , engulfing candle or red shooting star
Stop lost before pattern
R/R 1/3
Trade in 5 Min Timeframe, use signal for scalping

dogsusdtin my idea point of 0.0001375 reachable now we need some extra point to avoid falture point of vour tpv so easily use sl point to avoid last tp
