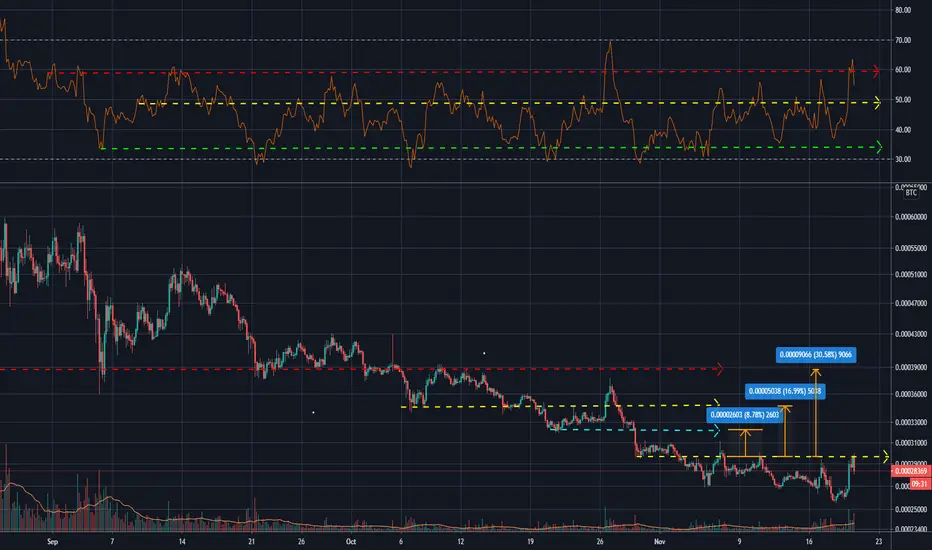
DOTBTC Local S/R| Declining Volume| Swing High| Price ActionEvening Traders,
Today’s analysis – DOTBTC – trading above Local S/R forming a potential higher low,
Points to consider,
- Price Action Impulsive
- Local S/R Support
- POC Resistance
- Declining Volume
- Double Bullish Divergence (RSI & Stochastics)
- Swing High Objective
DOTBTC’s immediate price action is showing strength at Local S/R, respecting this level allows us to have a bullish bias.
The current resistance is the local POC, breaking this level with conviction will increase the probability of a structural higher low.
Volume is on a decline which is indicative of an influx at a key trade location, currently being at one.
There is a valid double bullish divergence, the RSI and Stochastics are showing a higher low in respect to price action making a lower low, again signalling strength.
Overall, in my opinion, DOTBTC is a valid long with swing higher being the objective. Price Action is to be used upon discretion/ management.
Hope this analysis helps!
Thank you for following my work
And remember,
Trading is mostly a waiting game. if you want action that happens on your own terms, you’re in the wrong field.
DOTBTC trade ideas

DOTBTC Open Long Position | Educational PurposesDOTBTC Already Open Long Position | Publishing for educational purposes.
However, in case this retests support it might well be worth adding onto the current position.

DOTBTCBUY DOTBTC
Buy: 0,00027k-28915
Resistance to confirm break out: 0,00031263
Target : 0,00036325 / 39228 / 42516 / 44674 31263
SL: 0.00026019
if like the idea like and share pls

$DOT, Following this closely.. $DOT
Following this closely..
Volume still not there but looking good to start growing from current support level
Looking for that 1st UCTS buy signal..
Will update as soon as I see changes
#DOT


#PolkaDot ($DOT BTC) found its bottom and is ready to bounce!
Hello there ladies and gentlemen, BulloTaurus here with an awesome find!
BINANCE:DOTBTC is one of most-promising projects that had a huge rally when it was listed on major exchanges.
Huge gains were made by shorting it until now.
Bullish signals we can see on daily chart of Polkadot that will reward you with nice profits once we break the downtrend.
Risk: 5
Reward: 8
Disclaimer!
This post does not provide any direct financial advice. It is for educational purposes only! You can use the information from the post to make your own trading plan for the market.
But you must do your own research and use it as the priority.
Trading is risky, and it is not suitable for everyone.
Only you can be responsible for your trading.
Gentlemen, i need your help... if my ideas that you read are interesting and profitable, please hit the LIKE button to support me sharing my setups and ideas with YOU!
P.S. You're awesome. Keep doing it and you will achieve step by step your financial freedom!
Peace out.

DOT / BTC add to your watchlistDOT / BTC
After break long downtrend falling wedge since 75 days
Dot successed on retest above it
Iam currently Waiting for more confirmation before open a trade
Holding above ema 20 on daily (act as support) could send dot against btc to higher price and make good profit
This is not financial advice
Please have a plan before trading
And use stoploss
Good luck and happy trading 🌹

DOTBTCWith this bull cycle running, every dog will have its day. This coin is one of big caps that hasn't go wildly yet.
Confirmed bullish divergence and break out of descending wedge with increasing demands. Price is actually at the key level (thick blue line). Fibonacci levels show potential targets. But I believe it can go much further than that
Note : if you like this content, don't forget to give it a like and follow me for upcoming analysis.

DOT long-term falling wedge breakout!DOT/BTC has just broken out of its falling wedge that has been playing out since its initial exchange listing. This technical breakout, paired with rising volume, a trend reversal on the Squeeze Momentum Indicator, the first bullish candle on the SQZMOM, and a strong bounce off of it's August support suggest real potential here.

POLKADOT TREND REVERSAL? NEW HIGH UNDERWAY!The reasons why im bullish on polkadot TA wise.
- Falling wedge with decreasing volume
- Bullish 1D rsi
-bullish market structure break with printing a new high
Targets on the chart.
stoploss close under purple


DOTBTC Local S/R| 200 MA Support| Swing High| Daily S/REvening Traders,
Today’s analysis – DOTBTC- trading above local, maintain these regions is bullish in the immediate terms,
Points to consider,
- Price Action Bullish
- Local S/R Support (.382 Fibonacci Confluence)
- Daily S/R Target
- Declining Volume
- RSI Bullish Control
DOTBTC’s immediate price action is being accepted above Local S/R, this allows us to have a bullish bias on the market.
The Local S/R is in technical confluence with the .382 Fibonacci and 200 MA, price action has currently respected this level.
Daily S/R is current target, price action exceeding this level will increase the probability of trend continuation.
The volume profile is indicative of declining volume after an influx, this suggest a true break of Local S/R. Follow through in volume is required for a trend continuation.
The RSI is in its bullish control zone, remaining in these levels is critical for market strength.
Over all, in my opinion, DOTBTC is a valid long with defined risk; price action is to be used upon discretion/ management.
Hope this analysis helps!
Thank you for following my work
And remember!
The goal of a successful trader is to make the best trades. Money is secondary. – Alexander Elder

PolkaDot Breakout Setupone of the best project to invest right now
Buying the dip of this coin at this price is really good opportunity
Buy : 0.000305 below ( hold best fundamental)
Stop : 20% , no stop for mid term holder
Target : 0.00045 , 0.0006 , 0.00078 .. 3x to 5x min for mid term holder

$DOT, Levels that I'm watching$DOT
Levels that I'm watching to track if Altcoins start popping across the board..
For now, still waiting but setting some alerts won't hurt!
#DOT

$DOT to march higherRelative to BTC, Polkadot has bottomed and found support on the Supertrend.
On this 2day chart the candle ended yesterday with a bounce away from the Trend-line (Supertrend) and it looks like we will continue that way with how the current candle is shaping up.
The current candle ends 22nd November 0:00 UTC and if stays like this or betters than confirmation of the downtrend ends.
Also the Stochastic RSI has been oversold since the end of September, a move away from that level will see much more BTC flow into DOT.

elliot wave counting for DOTplease guide me if you think that it is a wrong counting.
i think DOT is entering to wave 4

DOT/BTC long on PolkadotDOT/BTC long on Polkadot
First Impulse
Long wedge consolidation
POssible upside breakout soon


LOOKING TO BUY THE BLUE BOXCurrently waiting for my orders to get filled in the blue box, no hurries.

