DOT is correctingDOT formed a bear pennant and got rejected at the resistance. Now it is coming back down to find support.
This is my second published idea
Input is appreciated
DOTBTC trade ideas

DOT with BTC pair in parallel channel#DOTBTC
BTC pair of DOT is trading inside a descending parallel channel, if this daily candle going to close below the blue support line, then price will drop more to the long term support zone, which is around the middle line of parallel channel.
In my point of view this support zone will hold the price and then we will see another rally to break the channel to touch 11900 sats.

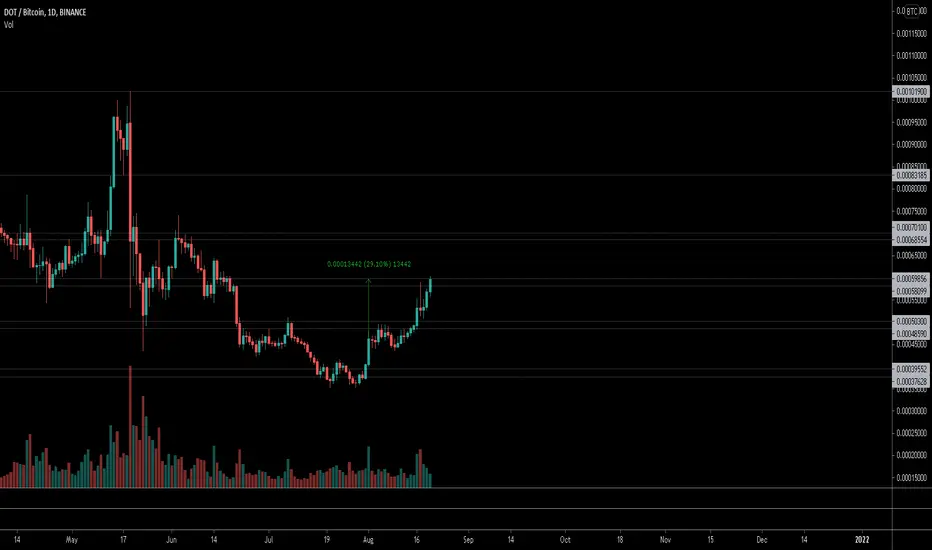
DOTBTC bullish...lovely bullish structure
up 50%+ against btc in a week
and forming a bullish pennant signalling possible continuation
expect this one to run for a while..

DOT is the best long in the market breaking range while bitcoin dumping. when it recovers expect a mega moon. 100%+ type move

DOT to absolutely RIPDOT breaking out the daily range clean. expect it to start trending upwards for the coming weeks..

DOT is going to pump above ATH Dot is printing a beautiful hammer candle on the weekly with a nice wick down through 8W MA, 20W MA and 21W EMA. Hammer candle signifies a bullish reversal and if BTC just holds in its range above its 8W MA (45k) DOT will pump to ATH. Parachain auctions are brewing with an intended launch of Mid-October. Interest over the next month will be HIGH.

DOT Polkadot BTC on the Daily *Cup and Handle with bull flag If btc continues strong and the market stays bullish. this perfect bull flag on the handle of a cup and handle is extremely bullish. Retraces and retest on another daily is possible. Dip or bust if bitcoin becomes volatile, and alts dump. There is a bear div that will need to be punched through.

DOT fib channel ideaHey all, i think due to the shape of DOT's previous run, it made sense to think of it in terms of a channel instead of a standard fib retracement/extension. Currently in XLM but can't wait to get back into DOT! Looking to triple in these coming months at least. Everything looks awesome for the next 6 months.

Polkadot DOT/BTCDots had a solid run over the last month, i only traded this on spot and was happy to ride the waves, how ever im feeling a possible retracement coming at the moment.
We have hit a level of resistance and after the run we have had and the 3 impulsive moves, I would be expecting a descent market correction over the next few weeks.
Bull case is a sharp and short term pull back met with a continuation of this current momentum, breaking the level of resistance and pushing higher for a new target.
Bear case is either a much deeper retracement or we double top at resistance and head back down to the EQ level between the 50-618 retracement of the entire run.
I would still consider that to be some what heathy market structure but not something I will hold onto.
Basically for this position im watching closely on this short term pull back, if there is a lot of selling i may take my profits early and let it cool down, if the selling is minimal and the pull back is slow, then ill hold my position and watch closely at a potential double top.

DOT run setupHi all,
I saw a few people in the chat mention DOT as a candidate for a huge run and taking a look at it myself, I believe that's close to coming to fruition. What I see is a weekly W pattern with midline bullish RSI trend, positive 14/47 (my equivalent of 20/50) EMAs, equally bullish USD and BTC pairs. I'm 60% in and I am absolutely confident that this will run even if BTC doesn't hold up. For targets, since there is an obvious swing low and high, I will use the BTC chart. Fib 1.618 extension from the previous low of 0.0001800 and high of 0.0010200 sits at around 0.0025000 which is about a 380% run from the current level of 0.0006600. It's difficult to pinpoint a target date based on the wide scale of this pattern but it looks like it may climax around January. Since this is on such a large scale, I suggest that you exit at your own discretion and risk tolerance (because a bearish confirmation might confirm at a significantly lower price point than the current price). Good luck!

$DOT, Slowly moving up, trying ~60k sats level$DOT
Slowly moving up, trying ~60k sats level on a ~30% movement since UCTS 1D Buy signal
For now looking for volume/flip around this area as signal of continuation..
Overall looks good and market sentiment seems to be allright as well
#DOT
dot its very important that dot can break the middle line of main chart . if dot success to break and hold the middle line of main chart then buy at point that show on chart.

DOTBTC weekly parallel channel#DOTBTC
DOT pair of BTC is in weekly parallel channel.
a long term line rejected the uptrend price.
Although I think price will continue its uptrend and break resistances to reach 0.0009 sats (upper line of parallel channel) that is more than 75% increase from here.
and if #DOT price break out from this parallel channel and close a weekly candle above the upper line, price will go up to touch 0.0014 sats (double the hight measure of parallel channel) which is 160% increase from here.

DOT/BTC thru critical resistanceDOT has reclaimed a prime zone on the BTC pair. The critical level to stay above is 0.00057 BTC. Only obstacle left before it moons is the $29 USD resistance level.


DOT looking good for another leg upwe may see a little resistance here till 50k satosi then we are ready to go for net moon ride

DOTBTC NEW PUMPDOTBTC NEW PUMP
Dot moving in potential rising channel. DOTBTC is testing the weekly support after a retest of the Fibonacci level.


DOTBTCI think we might be seeing an inverted head and soulders pattern in daily chart from DOT/BTC. Upside potencial goes to aproximately 0.00075 by this pattern. Shall we wait for the confirmation. In the way to the high point of the pattern it might be a resistance from a suport point of the last bear, breaking could throw the prices above the pattern prediction.


DOT/BTC textbook head & shouldersHi followers,
DOTBTC created a beautiful head and shoulders reversal pattern, right on the support area, confirmed already with a breakout of the neckline.
Don't forget to manage your risk! 👌
Good luck and trade with care 🙏
If you like my content - 👍 Like, 💬 comment, 👆 follow and 👉 share!
❗❗❗
Disclaimer: This information is not a recommendation to BUY or SELL. It is to be used for educational purposes only!

DOTUSDT is creating an inverse head and shoulders 🦐DOTUSDT is creating an inverse head and shoulders 🦐. According to Plancton's strategy (check our Academy ), we can set a nice order
–––––
Follow the Shrimp 🦐
Keep in mind.
🟣 Purple structure -> Monthly structure.
🔴 Red structure -> Weekly structure.
🔵 Blue structure -> Daily structure.
🟡 Yellow structure -> 4h structure.
⚫️ Black structure -> <4h structure.

