DOTBTC trade ideas

DOTBTC - Volatility IncomingIn my opinion, we are entering another defining phase in Polkadot's price history. Dubbed Phase 2, I expect this phase to bring back significant volatility to the asset. The way volatility will go, upwards or downwards, remains to be seen by LMACD. However, I believe there is a good chance that we are breaking above of our consolidation range and hitting greater ATH's with respect to our DOT BTC valuation.


$DOT, Pushing toward new all time high & into price discovery..$DOT
Pushing toward new all time high & into price discovery..
Volume rising on the daily while the 4H is already showing good continuation signals..
UCTS bullish on the 1D (Buy signal) & on lower timeframes..
Looking toward 90k sats from here if it gets traction🍀🤞
#DOT

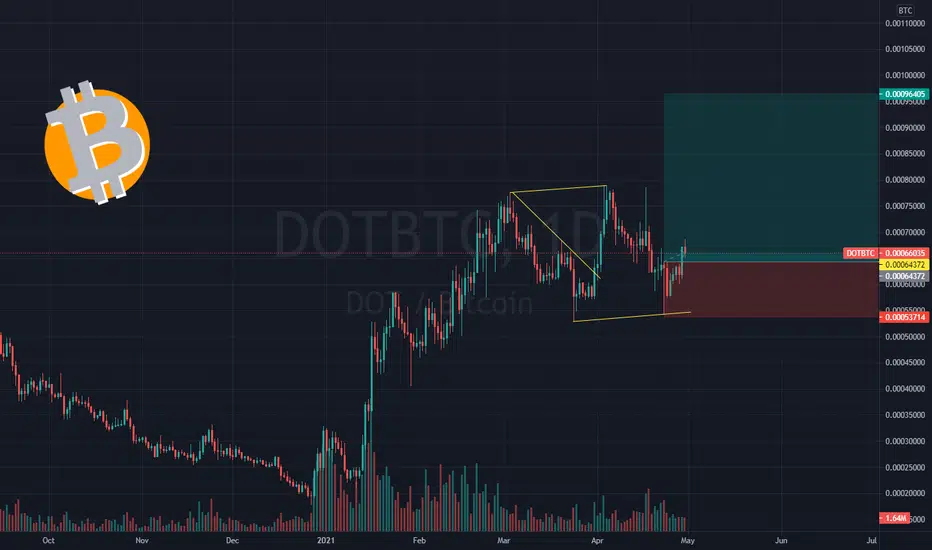
DOT:BTC Price ActionPrice has been trending between the two drawn areas of value (yellow rectangles) since mid-February.
May want to buy the breakout if it can get over 0.0008 or buy if resistance holds around the 0.00055 level.


BINANCE: DOT/BTC (Out of accumulation)🛒 Pair: DOT/BTC 🛒
== SPOT==
⏰ 1400/02/24 ⏰
🕰 14/05/2021 🕰
Duration:
📈 SHORT - MID📈
Ex: Binance
#186
🛒 Buy: 0.000785 - 0.000805 🛒
👉Sell Targets👈
🎯TP1: 0.00090 🥉
🎯TP2: 0.00099 🥈
🎯TP3: 0.00110 🥇
🎯TP4: 0.00120 🚁
⛔️ SL: Closing 4HRS candle below 1.72
**Risky Call**
**Broken out of accumulation zone**
Da. Box

DOTBTC - Long - Potential 11.53%DOTBTC - Long - Potential 11.53%
Exchanges: Binance
Signal Type: Regular (Long)
Entry Zone:
0.00068864 - 0.00070782
Take-Profit Targets:
1) 0.00073997
2) 0.00078803
Stop Targets:
1) 0.00065279
Trailing Configuration:
Entry: Percentage (0.0%)


DOT: 98k- 144k - 192k - 220k stsDOT will reach new high:
98k- 144k - 192k - 220k sts
At 220k sts, 1 DOT ~ 200 USD = WOW!

Dot waking up?? We could expect upsite from DOT/BTC soon. It's clear that we have been moving around this upward trending band for some time now. It is looking like the next move up within this band is coming soon. It's time for dot to WAKE UP again.


DOT/BTC - Bullish Pennant Forming Hey people!
After an extremly bullish leg up with alot of hype around the project in Q1 21, DOT consolidated nicely for 2 months now and is forming a bullish pennant. We are still early in the pattern at the second impulse down and with sitting around the 61,8 Fibonacci retracement at 63.000 Sats , the entry point is quite good.
If it brakes the resistance around 78.000 Sats , the measured move price target should be at around 103.500 Sats . From its current price point that would mean a 63,5% move to the upside , with a tendency to overshoot the target considering the current bullish sentiment for altcoins. In case of a bearish turn my Stop-Loss would be around 51.500 Sats. This would equal to a Risk/Reward Ratio of 3.42.
Enjoy!
BINANCE:DOTBTC

#dotbtc long ideaFiat is moving valid range I think. If green area works support (I hope) my first target is midrange and second target is range high.Close daily candle under green area is trigger my stop.Good luck...

Polkadot [DOT] to continue upwards movement
This is my first published idea, I generally do all my drawings on Binance tradingview tab, cannot export them sadly.
Some quick explanations:
0 - This is the move where we start entering the rising trading channel
1 - These are rising wedges within rising trading channel
2 - These are descending wedges within rising trading channel
Each time DOT has had it's rising wedge movement broken, it turns into a descending wedge, once trading channel bottom has been touched, a move to break out from descending wedge and continued upwards movement is formed.
Once a breakout from current descending wedge has been confirmed, we can expect further upside to atleast the top of the trading channel.
TLDR:
I am stacking up on DOT expecting the move explained in the chart.

POLKADOT SEEMS HEALTHY dot/btc chart : according to the chart it is set to test the upper resistance zone , if we surpass it , {as we are in the altseason ,maybe , it has chances to break, after that POLKADOT will be in price discovery.
as we notice the volume is decreasing day by day , as we look left after that volume decrease DOT had a huge spike upside , probabilities are for the same to happen, with a 3 - 3.5 x from its current price


